. 2013 Aug 1;126(Pt 15):3493-503.
doi: 10.1242/jcs.130872. Epub 2013 May 31.

SA1 binds directly to DNA through its unique AT-hook to promote sister chromatid cohesion at telomeres

Affiliations

SA1 binds directly to DNA through its unique AT-hook to promote sister chromatid cohesion at telomeres

Kamlesh K Bisht et al. J Cell Sci. .

Abstract

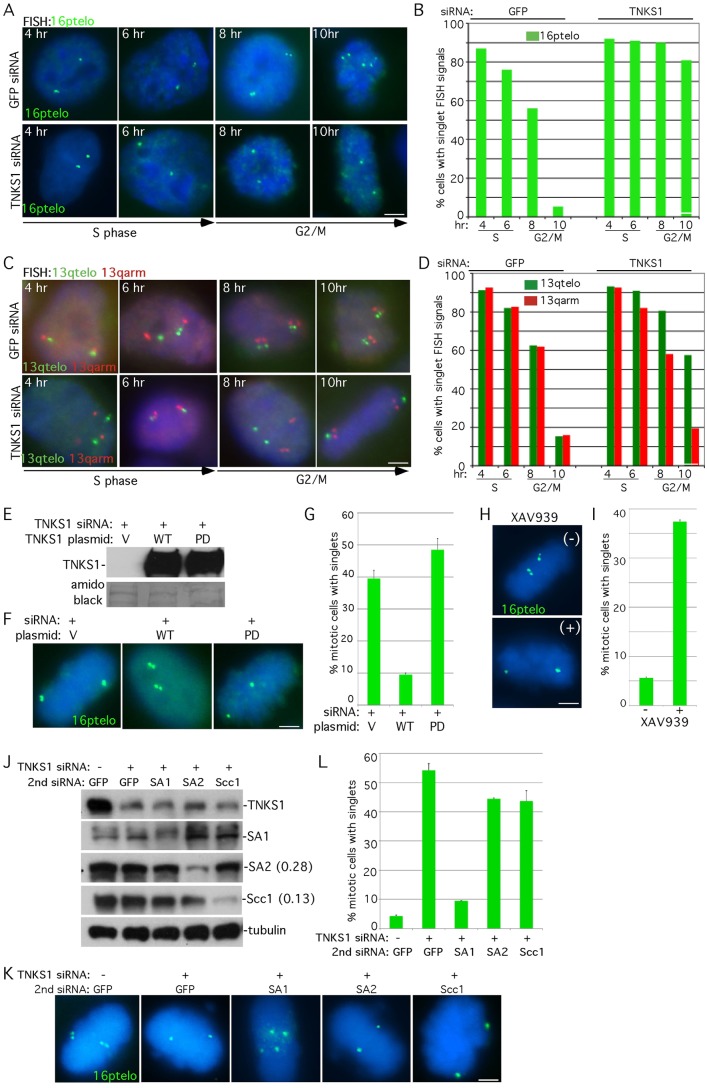
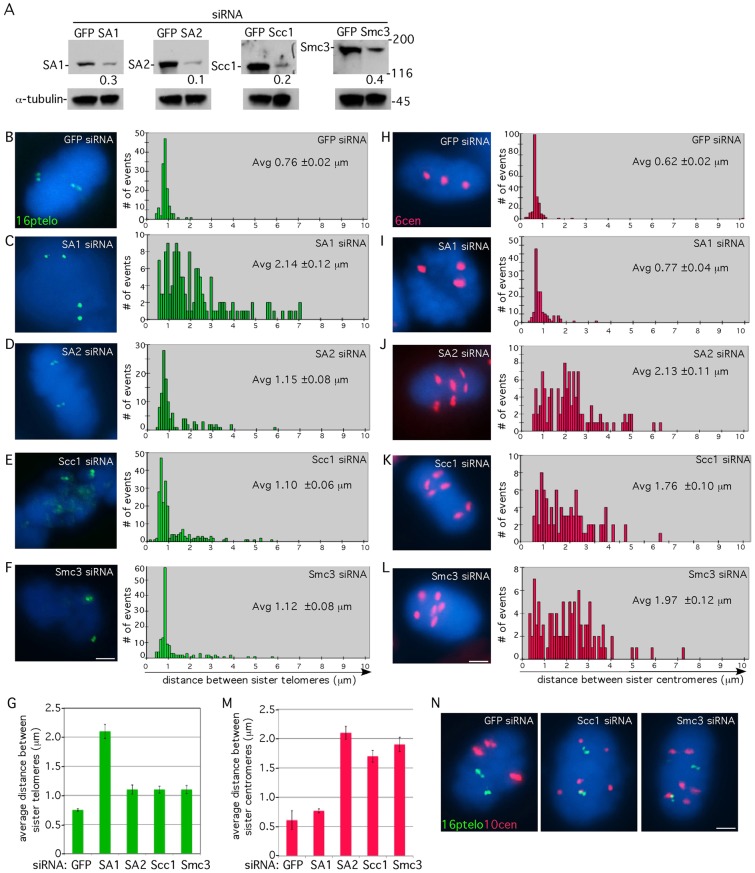
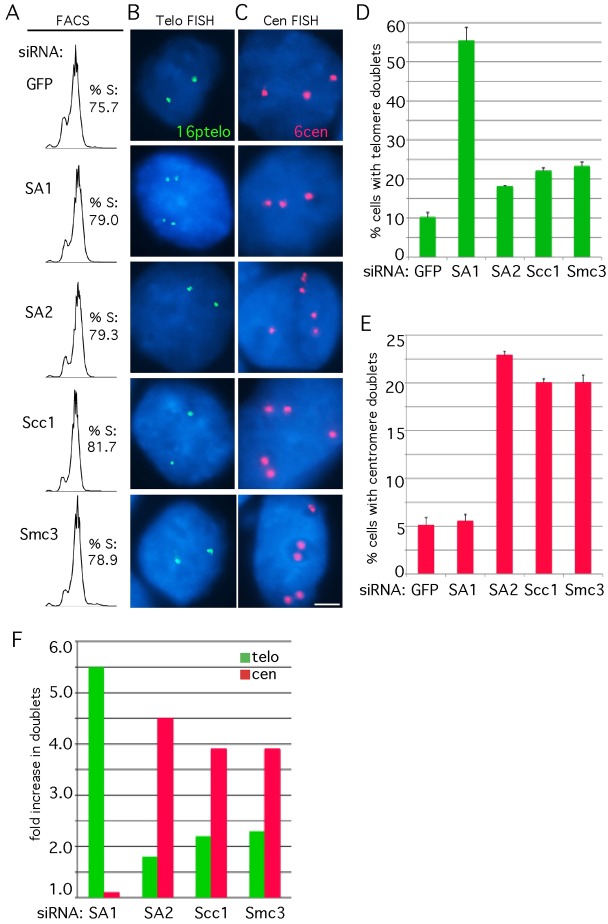
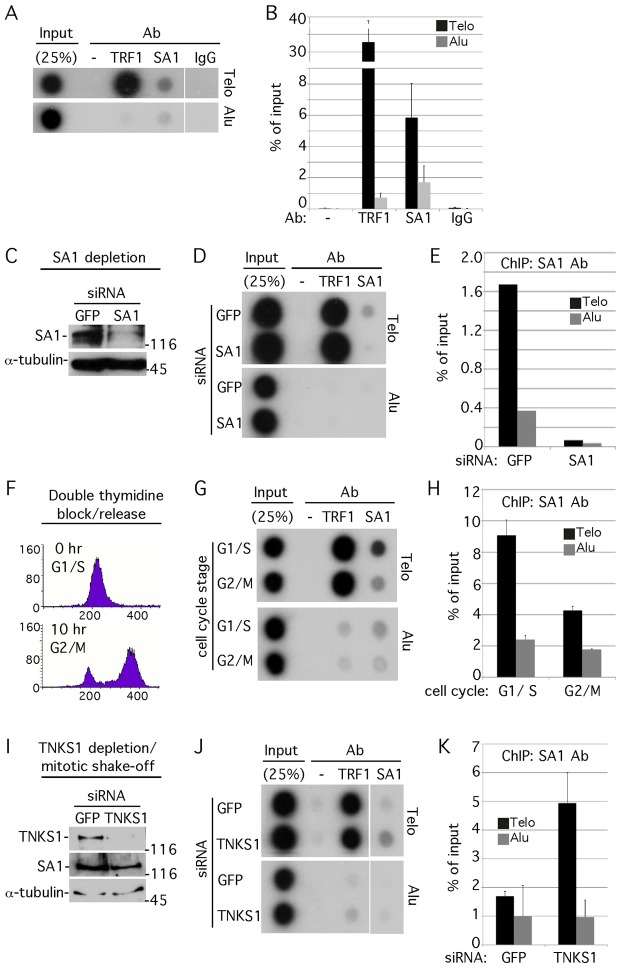
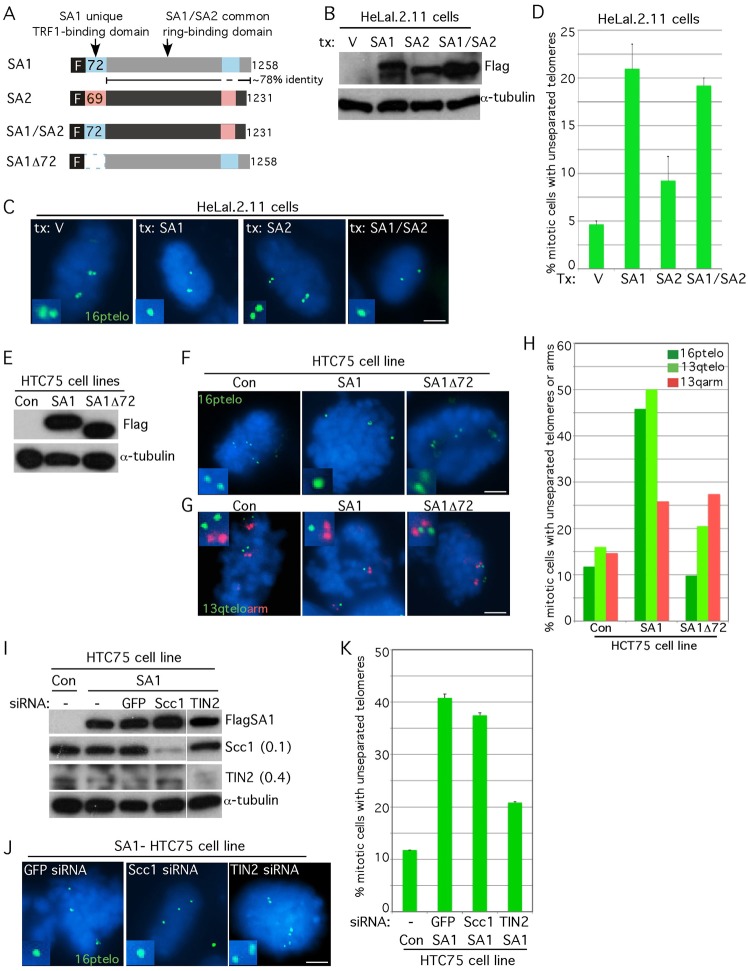
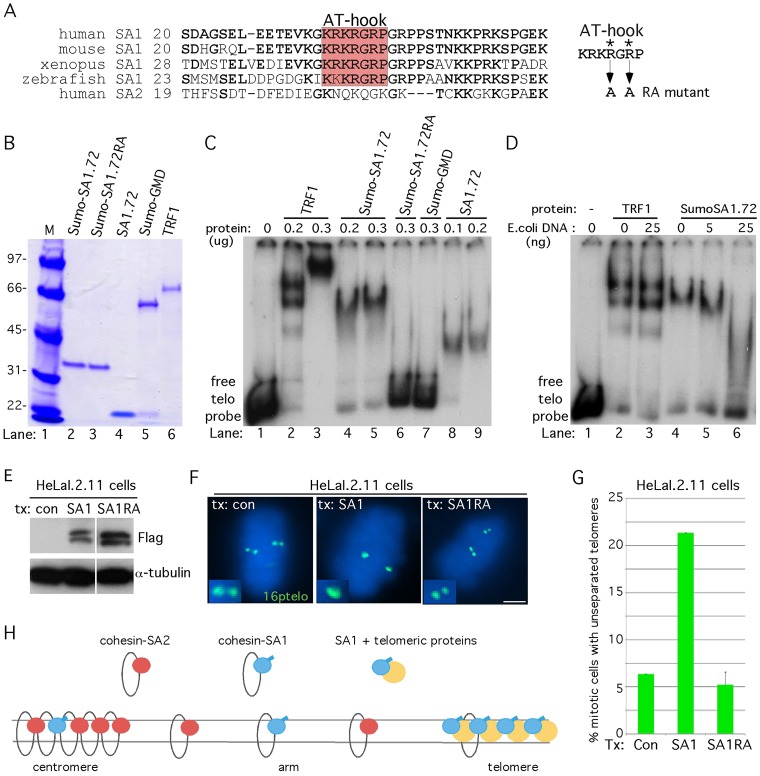
Sister chromatid cohesion relies on cohesin, a complex comprising a tri-partite ring and a peripheral subunit Scc3, which is found as two related isoforms SA1 and SA2 in vertebrates. There is a division of labor between the vertebrate cohesin complexes; SA1-cohesin is required at telomeres and SA2-cohesin at centromeres. Depletion of SA1 has dramatic consequences for telomere function and genome integrity, but the mechanism by which SA1-cohesin mediates cohesion at telomeres is not well understood. Here we dissect the individual contribution of SA1 and the ring subunits to telomere cohesion and show that telomeres rely heavily on SA1 and to a lesser extent on the ring for cohesion. Using chromatin immunoprecipitation we show that SA1 is highly enriched at telomeres, is decreased at mitosis when cohesion is resolved, and is increased when cohesion persists. Overexpression of SA1 alone was sufficient to induce cohesion at telomeres, independent of the cohesin ring and dependent on its unique (not found in SA2) N-terminal domain, which we show binds to telomeric DNA through an AT-hook motif. We suggest that a specialized cohesion mechanism may be required to accommodate the high level of DNA replication-associated repair at telomeres.

Keywords: Cohesion; SA1; Telomeres.


Figures

Fig. 1.
Fig. 1.
Resolution of telomere cohesion occurs in G2/M and is dependent on PARP-active tankyrase 1. (A–D) Cell cycle analysis of cohesion. HeLa.I.2.11 cells were synchronized by a double thymidine block, treated with control (GFP) or TNKS1 siRNA, released at 4, 6, 8 and 10 hours, and analyzed by FISH with (A) a 16ptelo (green) or (C) a 13qtelo (green) and 13qarm (red) probe. (B,D) Graphical representation of the frequency of cells with singlet FISH signals from (A; n = 250 cells or more each) and (C; n = 150 cells each), respectively. (E–I) Resolution of sister telomere cohesion requires the PARP activity of tankyrase 1. (E–G) Supertelomerase HeLa cells were synchronized by a double thymidine block, co-transfected with tankyrase 1 siRNA and a control vector (V) or a plasmid containing tankyrase 1 wild type (WT) or PARP-Dead (PD), released for 10 hours, isolated by mitotic shake-off, and analyzed by (E) immunoblot or by (F) FISH with a 16ptelo probe. (G) Graphical representation of the frequency of mitotic cells with singlet FISH signals derived from two independent experiments. Values are means ± s.e.m. (n = 20 cells or more each). (H,I) HeLa1.2.11 cells were synchronized by a double thymidine block, released for 10 hours in the absence (−) or presence (+) of the tankyrase PARP inhibitor XAV939 (1 µm), isolated by mitotic shake-off and analyzed by (H) FISH with a 16ptelo probe. (I) Graphical representation of the frequency of mitotic cells with singlet FISH signals. Values are means ± s.d. from three independent experiments (n = 99 cells or more each). (J–L) Tankyrase 1-induced persistent telomere cohesion is rescued by depletion of SA1, but not by depletion of SA2 or the cohesin ring. HeLaI.2.11 cells were transfected without (−) or with (+) TNKS1 siRNA along with a second siRNA against GFP, SA1, SA2 or Scc1 for 48 hours and analyzed by (J) immunoblot (protein levels relative to α-tubulin and normalized to the GFP siRNA control are indicated next to the blots) or isolated by mitotic shake-off, and analyzed by (K) FISH using a 16ptelo probe (green). (L) Graphical representation of the frequency of mitotic cells with unseparated telomeres in mitosis. Values are means ± s.e.m. from two independent experiments (n = 120 cells or more each). In A, C, F, H, and K DNA was stained with DAPI (blue). Scale bars: 5 µm.
Fig. 2.
Fig. 2.
Telomere cohesion is maintained in mitosis in cohesin-ring-depleted cells. (A) Immunoblot analysis of extracts from HeLaI.2.11 cells transfected with siRNA to GFP, SA1, SA2, Scc1 or Smc3 for 48 hours and probed with the indicated antibodies. Protein levels relative to α-tubulin and normalized to the GFP siRNA control are indicated below the blots. (B–F) Telomere and (H–L) centromere FISH analysis of HeLaI.2.11 cells isolated by mitotic shake-off following 48 hours transfection with GFP (B,H), SA1 (C,I), SA2 (D,J), Scc1 (E,K) or Smc3 (F,L) siRNA with a 16ptelo (green) or 6cen (red) probe. The cen locus is trisomic. DNA was stained with DAPI (blue). Scale bars: 5 µm. Histograms showing the distance between FISH signals (n = 98–225) are on the right with the average (Avg) distance (± s.e.m.) indicated. (G,M) Graphical representation of the average distance (± s.e.m.) between sister telomeres (G) or centromeres (M). (N) Combined telomere and centromere FISH analysis. HeLaI.2.11 cells were transfected with GFP, Scc1 or Smc3 siRNA for 48 hours and probed with 16ptelo (green) and 10cen (red). The cen locus is trisomic. DNA was stained with DAPI (blue). Scale bar: 5 µm.
Fig. 3.
Fig. 3.
Telomere cohesion is established in S phase in cohesin-ring-depleted cells. HeLa.I.2.11 cells were synchronized by a double thymidine block, treated with siRNA against GFP, SA1, SA2, Scc1 or Smc3 and analyzed by (A) FACS, (B) telomere FISH with a telomere 16ptelo (green), or (C) centromere FISH with a 6cen (red) probe 4 hours after release from the second thymidine block. DNA was stained with DAPI (blue). Scale bar: 5 µm. (D,E) Graphical representation of the frequency of telomere (from B; n = 514 cells or more each) and centromere (from C; n = 441 cells or more each) doublets in S phase, respectively. Values are means ± s.e.m., derived from two independent experiments. (F) Graphical representation of the fold increase in telomere (from D) and centromere (from E) doublets relative to the GFP siRNA control.
Fig. 4.
Fig. 4.
SA1 associates with telomeres in vivo. (A,B) Telomeric ChIP analysis of TRF1 and SA1. (A) Autoradiograph showing telomeric DNA ChIP analysis of HeLaI.2.11 cells using the indicated antibodies. Dot blots with the immunoprecipitated DNA were analyzed by Southern blotting with 32P-labelled telomeric (Telo) or Alu repeat (Alu) probes. (B) Graphical representation of the percentage of immunoprecipitated Telo or Alu DNA relative to total input DNA (as in A), derived from four independent experiments. Values are means ± s.d. (C–E) Ablation of the SA1 signal at telomeres by SA1 siRNA. HelaI.2.11 cells were transfected with siRNA to GFP or SA1 for 48 hours and analyzed by (C) immunoblotting with antibodies against SA1 or α-tubulin and (D) telomeric ChIP with antibodies against TRF1 or SA1. (E) Graphical representation of the percentage of SA1-immunoprecipitated Telo or Alu DNA relative to total input DNA (as in D). (F–H) SA1 is reduced at telomeres in mitosis. HeLaI.2.11 cells were synchronized by a double thymidine block, released, and collected by trypsinization at 0 hours (G1/S) or 10 hours (G2/M) and analyzed by (F) FACS (y-axis, cell numbers; x-axis, relative DNA content based on propidium iodide staining) and (G) telomeric ChIP with antibodies against TRF1 or SA1. (H) Graphical representation of the percentage of SA1-immunoprecipitated Telo or Alu DNA relative to total input DNA (as in G). Values are means ± s.e.m., derived from two independent experiments. (I–K) SA1 is increased at telomeres in TNKS1-depleted mitotic cells. HelaI.2.11 cells were transfected with siRNA to GFP or TNKS1 for 48 hours, isolated by mitotic shake-off, and analyzed by (I) immunoblotting with antibodies against TNKS1, SA1 or α-tubulin and (J) telomeric ChIP with antibodies against TRF1 or SA1. (K) Graphical representation of the percentage of SA1-immunoprecipitated Telo or Alu DNA relative to total input DNA (as in J). Values are means ± s.e.m., derived from two independent experiments.
Fig. 5.
Fig. 5.
SA1 induces persistent sister chromatid cohesion at telomeres. (A) Schematic representation of FLAG-tagged SA1, SA2 and mutant alleles SA1/SA2 and SA1Δ72. (B–D) Overexpression of SA1 but not SA2, induced persistent telomere cohesion. HeLaI.2.11 cells were transfected with vector, SA1, SA2 or SA1/SA2 for 20 hours and analyzed by (B) immunoblot and (C) telomere FISH using a 16ptelo probe (green) following mitotic shake-off. (D) Graphical representation of the frequency of mitotic cells with unseparated telomeres. Values are means ± s.e.m., derived from two independent experiments (n = 68 cells or more each). (E–H) SA1 induced persistent cohesion specifically at telomeres, dependent on its N-terminal domain. Stable HTC75 cell lines overexpressing SA1 or SA1Δ72 or control cells (Con) were analyzed by (E) immunoblot, (F) telomere FISH using a 16ptelo probe or (G) by double FISH with a 13qtelo (green) and 13qarm (red) probe following mitotic shake-off. (H) Graphical representation of the frequency of mitotic cells with unseparated telomeres or arms (n = 102 cells or more each). (I–K) SA1 induced persistent telomere cohesion independent of Scc1, but dependent on TIN2. Stable SA1-HTC75 or control cells were treated without (−) or with siRNA against GFP, Scc1 or TIN2 and analyzed by (I) immunoblot (protein levels relative to α-tubulin and normalized to the GFP siRNA control are indicated next to the blots) and (J) telomere FISH using a 16ptelo probe (green) following mitotic shake-off. (K) Graphical representation of the frequency of mitotic cells with unseparated telomeres. Values are means ± s.e.m., derived from two independent experiments (n = 29 cells or more each). In C, F, G and J DNA was stained with DAPI (blue). Scale bars: 5 µm.
Fig. 6.
Fig. 6.
SA1 binds to telomeric DNA in vitro and promotes persistent telomere cohesion in vivo through its AT-hook. (A) Alignment of the SA1 domain containing the AT-hook. Amino acids identical to human SA1 are in bold. The AT-hook RA mutation is indicated on the right. (B–D) SA1 binds telomeric DNA. (B) Purified recombinant proteins (500 ng each) were fractionated by SDS-PAGE and visualized by staining with Coomassie Blue. (C,D) Autoradiographs of the telomere repeat binding assay with the indicated recombinant proteins and a 32P-labeled (TTAGGG)12 probe. SA1 binds to telomeric DNA dependent on the AT-hook (C). Addition of E. coli competitor DNA competes for SA1, but not TRF1, binding to telomeric DNA (D). (E–G) SA1 promotes persistent telomere cohesion dependent on its AT-hook. HeLaI.2.11 cells were transfected with a vector control, SA1 and SA1RA for 20 hours and analyzed by (E) immunoblot and (F) telomere FISH using a 16ptelo probe (green) following mitotic shake-off. Scale bar: 5 µm. (G) Graphical representation of the frequency of mitotic cells with unseparated telomeres. Values are means ± s.e.m., derived from two independent experiments (n = 102 cells or more each). (H) Model of how SA1 promotes cohesion independent of the cohesin ring by associating with telomeric DNA and proteins.

References

    1. Anderson D. E., Losada A., Erickson H. P., Hirano T. (2002). Condensin and cohesin display different arm conformations with characteristic hinge angles. J. Cell Biol. 156, 419–424 10.1083/jcb.200111002 - DOI - PMC - PubMed
    1. Aravind L., Landsman D. (1998). AT-hook motifs identified in a wide variety of DNA-binding proteins. Nucleic Acids Res. 26, 4413–4421 10.1093/nar/26.19.4413 - DOI - PMC - PubMed
    1. Bianchi A., Smith S., Chong L., Elias P., de Lange T. (1997). TRF1 is a dimer and bends telomeric DNA. EMBO J. 16, 1785–1794 10.1093/emboj/16.7.1785 - DOI - PMC - PubMed
    1. Bisht K. K., Dudognon C., Chang W. G., Sokol E. S., Ramirez A., Smith S. (2012). GDP-mannose-4,6-dehydratase is a cytosolic partner of tankyrase 1 that inhibits its poly(ADP-ribose) polymerase activity. Mol. Cell. Biol. 32, 3044–3053 10.1128/MCB.00258-12 - DOI - PMC - PubMed
    1. Canudas S., Smith S. (2009). Differential regulation of telomere and centromere cohesion by the Scc3 homologues SA1 and SA2, respectively, in human cells. J. Cell Biol. 187, 165–173 10.1083/jcb.200903096 - DOI - PMC - PubMed

Publication types

LinkOut - more resources