. 2013 Jun 11;110(24):E2239-48.
doi: 10.1073/pnas.1221206110. Epub 2013 May 31.

Selective Kv1.3 channel blocker as therapeutic for obesity and insulin resistance

Affiliations

Selective Kv1.3 channel blocker as therapeutic for obesity and insulin resistance

Sanjeev Kumar Upadhyay et al. Proc Natl Acad Sci U S A. .

Abstract

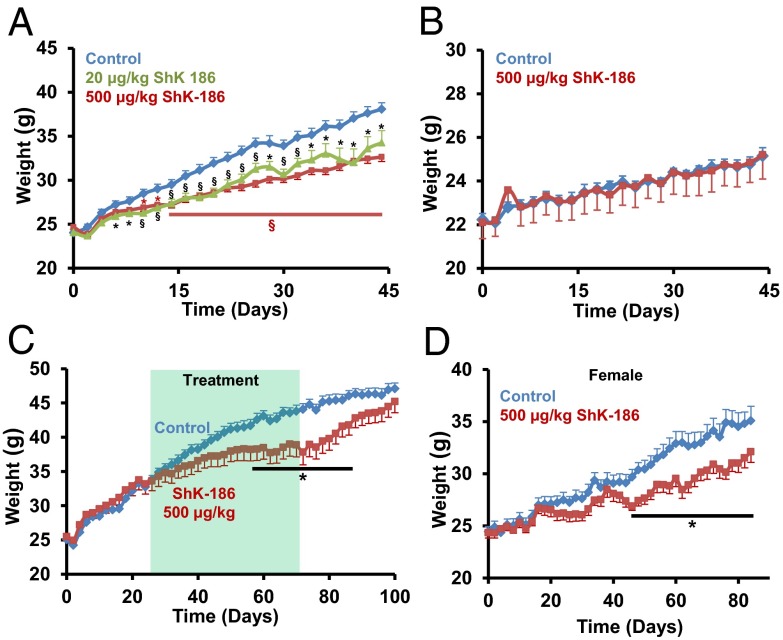
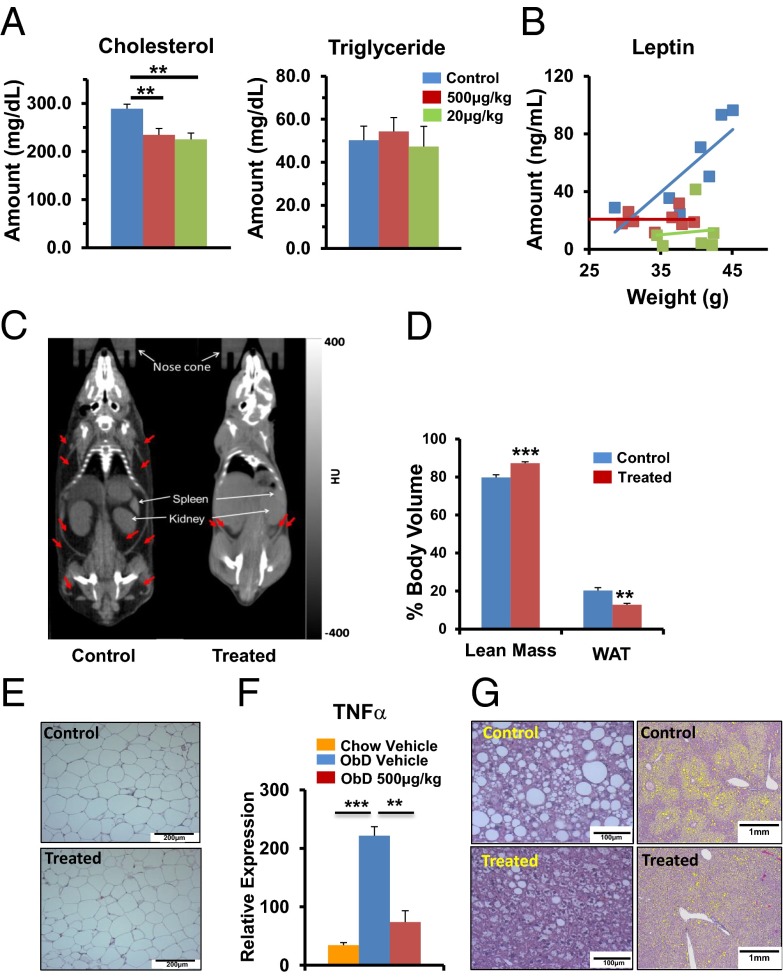
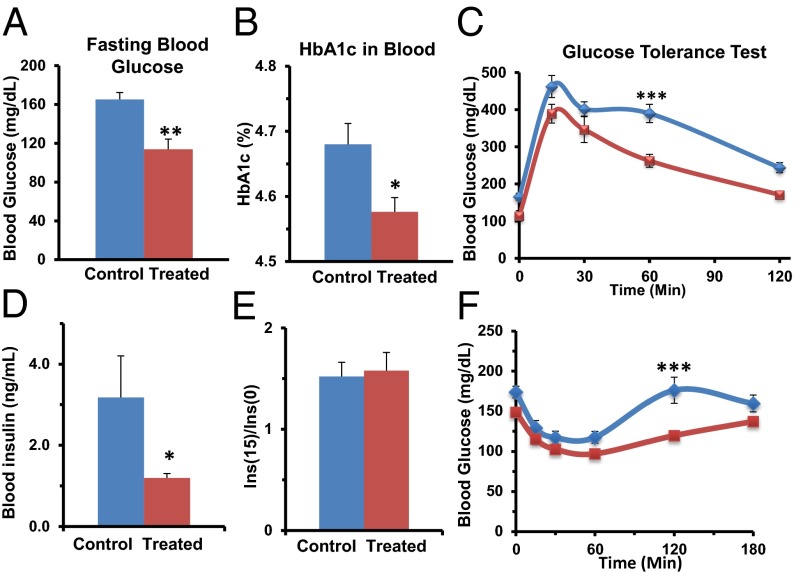
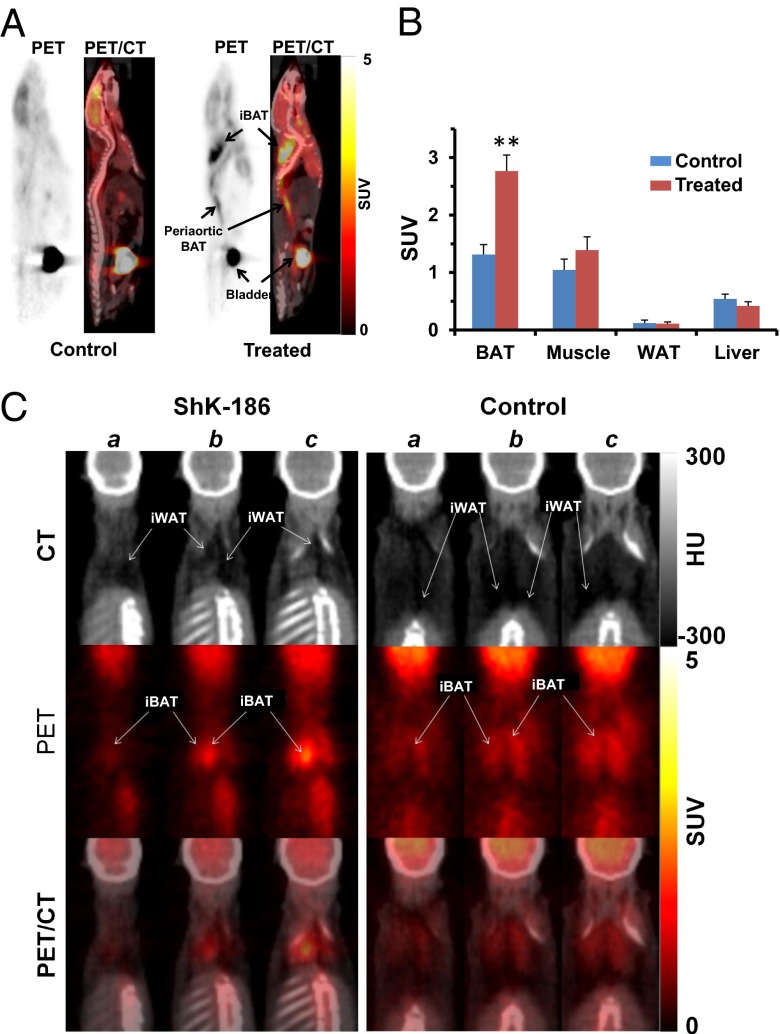
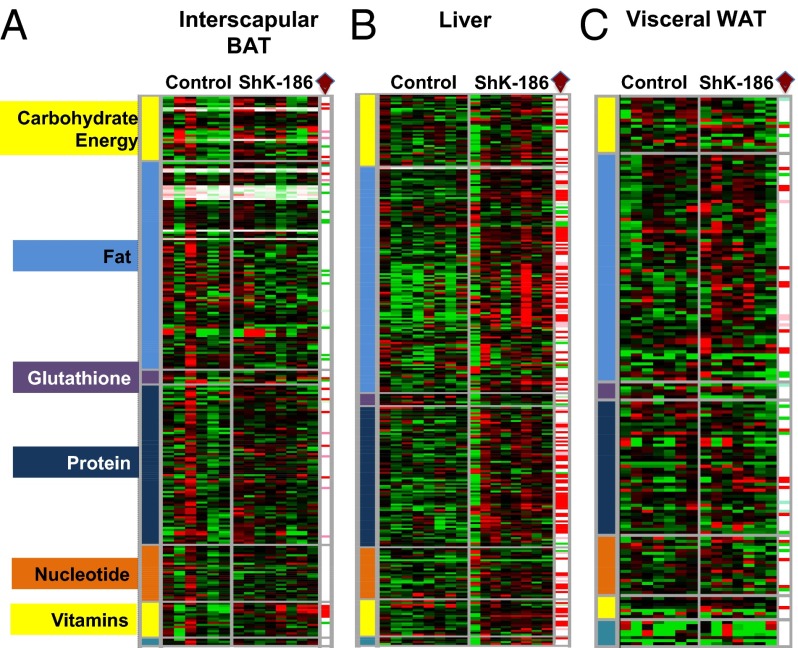
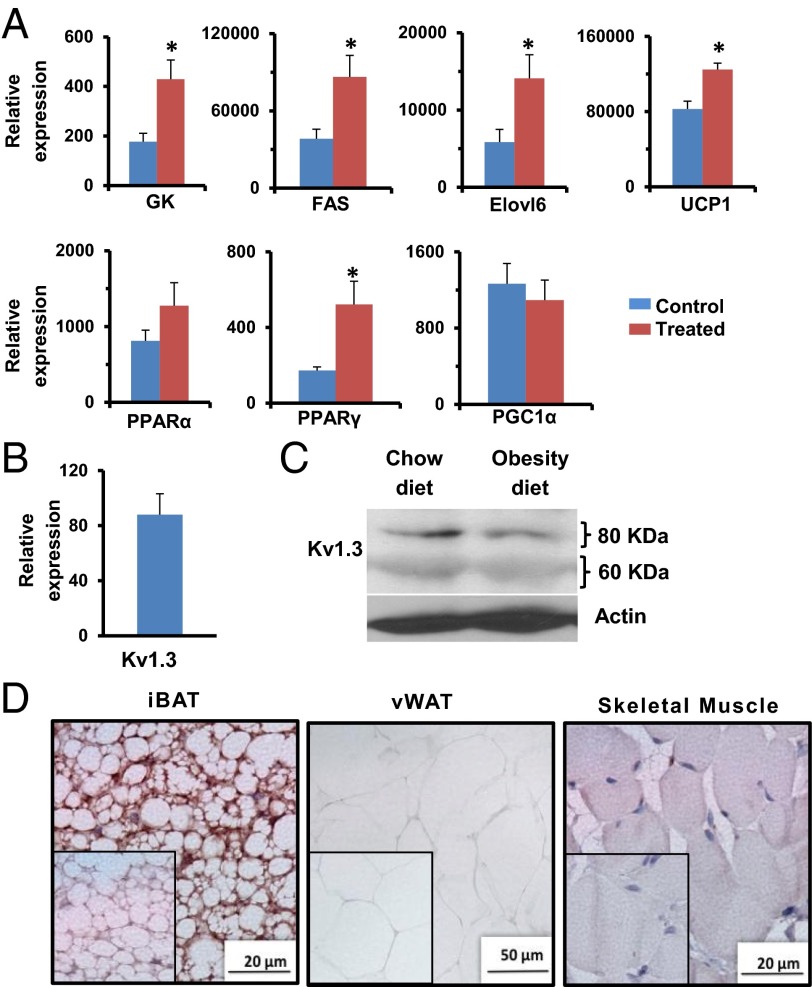
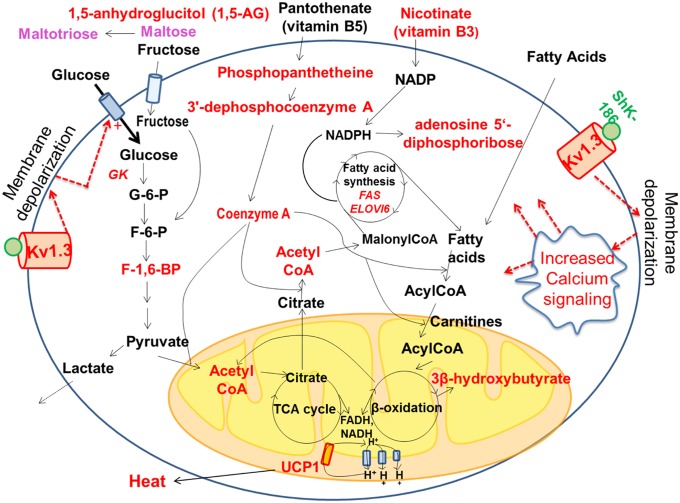
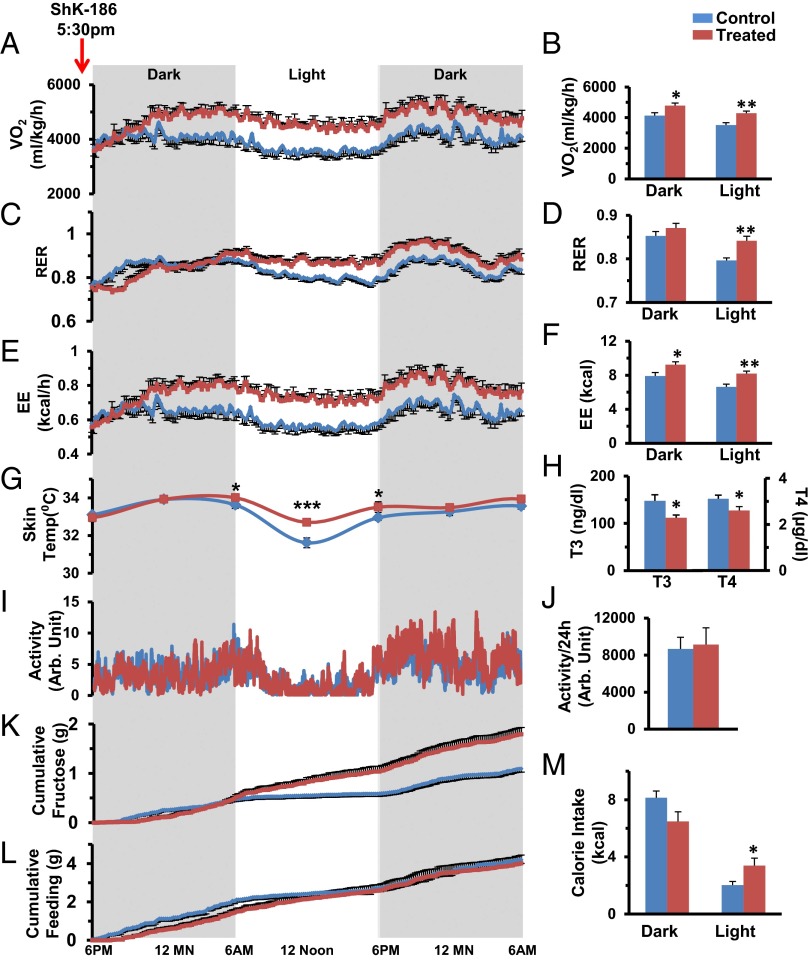
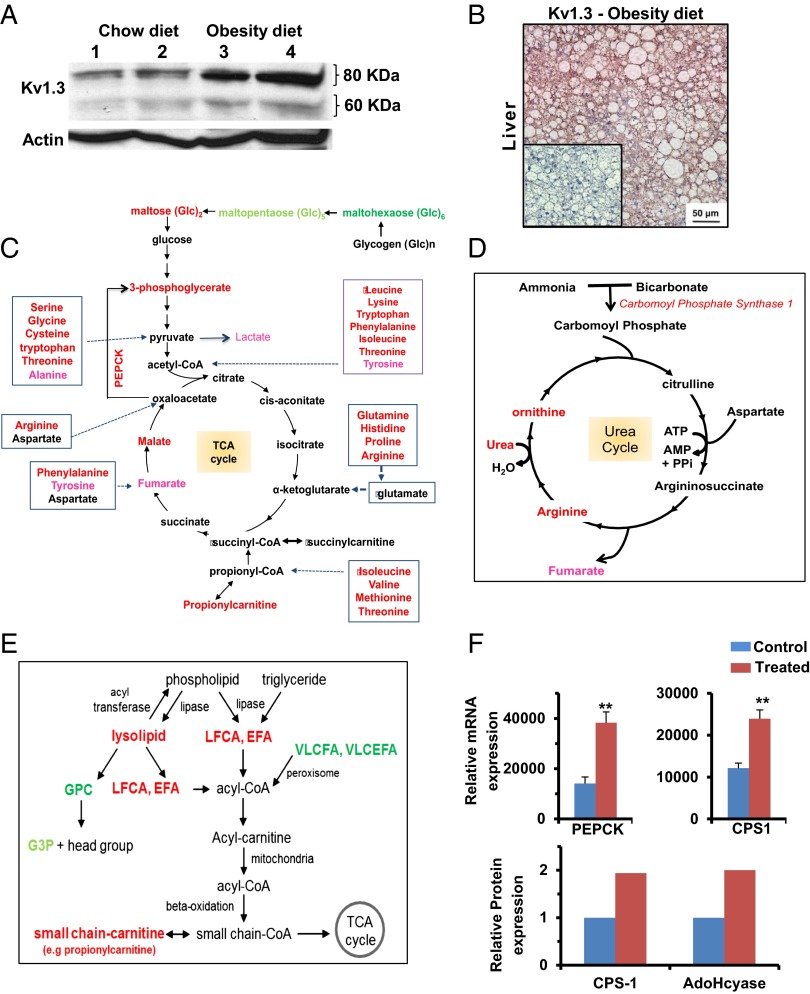
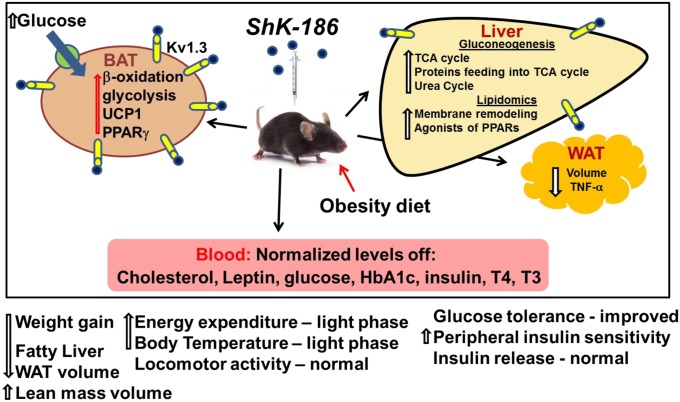
Obesity is an epidemic, calling for innovative and reliable pharmacological strategies. Here, we show that ShK-186, a selective and potent blocker of the voltage-gated Kv1.3 channel, counteracts the negative effects of increased caloric intake in mice fed a diet rich in fat and fructose. ShK-186 reduced weight gain, adiposity, and fatty liver; decreased blood levels of cholesterol, sugar, HbA1c, insulin, and leptin; and enhanced peripheral insulin sensitivity. These changes mimic the effects of Kv1.3 gene deletion. ShK-186 did not alter weight gain in mice on a chow diet, suggesting that the obesity-inducing diet enhances sensitivity to Kv1.3 blockade. Several mechanisms may contribute to the therapeutic benefits of ShK-186. ShK-186 therapy activated brown adipose tissue as evidenced by a doubling of glucose uptake, and increased β-oxidation of fatty acids, glycolysis, fatty acid synthesis, and uncoupling protein 1 expression. Activation of brown adipose tissue manifested as augmented oxygen consumption and energy expenditure, with no change in caloric intake, locomotor activity, or thyroid hormone levels. The obesity diet induced Kv1.3 expression in the liver, and ShK-186 caused profound alterations in energy and lipid metabolism in the liver. This action on the liver may underlie the differential effectiveness of ShK-186 in mice fed a chow vs. an obesity diet. Our results highlight the potential use of Kv1.3 blockers for the treatment of obesity and insulin resistance.

Keywords: brown fat; diabetes mellitus; inflammation; metabolic syndrome; potassium channel.


Conflict of interest statement

Conflict of interest statement: S.K.U., K.L.E.-M., M.R.M., S.I., P.H.W., P.S.-C., J.M., and K.G.C. are coinventors of a patent on ShK-186 and obesity filed by the University of California and licensed to Kineta, Inc. S.I. is the Chief Scientific Officer of Kineta, Inc. K.G.C. owns stock options (<5%) in Kineta, Inc.

Figures

Fig. 1.
Fig. 1.
ShK-186 reduces weight gain in mice on obesity diet. (A) Prevention trial, males on obesity diet: ShK-186 (20 or 500 μg/kg on alternate days) (TD.88137 + 60% fructose/water (wt/vol); calorie contribution: fat 30.1%; carbohydrate 59%; protein 10.9%). Control: n = 19; 500 μg/kg: n = 30; 20 μg/kg: n = 19. Repeated-measures two-way ANOVA with post hoc Bonferroni correction; *P < 0.05, **P < 0.01, §P < 0.001 (black symbols: control vs. 20 μg/kg; brown symbols: control vs. 500 μg/kg). (B) Prevention trial, males on chow diet: ShK-186 (500 μg/kg) (TD.7001 4% fat + water; calorie contribution: fat 13%; carbohydrate 53%; protein 34%). Control: n = 8; ShK-186 500 μg/kg: n = 5. Pairwise Student t test was used to determine statistical significance. (C) Treatment trial, males on obesity diet: ShK-186 (500 μg/kg) administered 3 wk after onset of obesity diet. Shaded area shows 45-d period when ShK-186 or vehicle were administered. Bar shows time period over which P < 0.05. For all experiments, n = 6–8 in each group. All graphs depict mean ± SEM. Control: n = 6; 500 μg/kg: n = 7. (D) Prevention trial, females on obesity diet: ShK-186 (500 μg/kg on alternate days). The plot starts at a weight corresponding to the starting weight in males (∼23 g, females aged 15 wk). Control: n = 8; ShK-186 500 μg/kg: n = 8. Student t test: *P < 0.05.
Fig. 2.
Fig. 2.
ShK-186 decreases adiposity in mice fed the obesity-inducing diet. (A) ShK-186’s (20 and 500 μg/kg) effect on blood cholesterol and triglyceride (one-way ANOVA: control vs. 20 or 500 μg/kg; **P < 0.01). (B) Blood leptin level plotted against body weight. Same color code as for A. (C) CT scans show images in Hounsfield units of darkened areas of WAT (identified by red arrows) in a vehicle-control (Left) and ShK-186–treated mouse (Right). (D) ShK-186’s effect on the percentage of body volume comprised of WAT (Student t test: **P = 0.004) and lean tissue (***P = 0.0004), n = 6 mice per group. Average weight ± SEM of control and treated animals used in the study were 36.5 ± 2.6 g and 30.4 ± 3.2 g, respectively. (E) H&E stain of abdominal WAT from control and treated mice. (Scale bar: 200 μm.) (F) TNFα mRNA increases in visceral WAT in mice fed an obesity diet compared with a chow diet (one-way ANOVA: ***P < 0.001). ShK-186 treatment of mice fed the obesity diet reduced TNFα mRNA levels to that in chow-fed mice (one-way ANOVA: **P < 0.01). (G) H&E stain at high (Left) and low (Right) magnification show lipid-laden vesicles in the liver. (Scale bars: Left, 100 μm; Right, 1 mm.) All measurements were made 10 wk after the start of the obesity diet and every other day s.c. administration of vehicle or ShK-186 (500 μg/kg); n = 6 in each group. All bar graphs depict mean ± SEM.
Fig. 3.
Fig. 3.
ShK-186 reduces hyperglycemia and improves glucose tolerance in mice fed the obesity-inducing diet. (A and B) Blood sugar (A, Student t test; P = 0.002) and HbA1c (B, Student t test; P = 0.012). (C) Intraperitoneal glucose tolerance test: AUCcontrols = 42,075 mg/dL × min; AUCtreated = 31,420 mg/dL × min; repeated-measures two-way ANOVA with post hoc Bonferroni correction: 60 min: ***P < 0.001. (D) Fasting insulin levels in controls (3.2 ± 0.9 ng/mL) and ShK-186–treated mice (1.2 ± 0.1 ng/mL); Student t test; **P < 0.03. (E) Fold-increase in insulin release shown as the ratio of the insulin level 15 min after glucose challenge vs. the level before glucose challenge. (F) Insulin tolerance test to measure peripheral insulin sensitivity: AUCcontrol = 26,525 mg/dL × min; AUCtreated = 20,818 mg/dL × min, repeated-measures two-way ANOVA with post hoc Bonferroni correction, 120 min: ***P < 0.001. Measurements at week 10 of the study; n = 6–8 mice in each group. All graphs depict mean ± SEM.
Fig. 4.
Fig. 4.
ShK-186 doubles 18F-FDG uptake into BAT without changing uptake into WAT, skeletal muscle, or liver. (A) PET and PET/CT images of 18F-FDG standardized uptake value (SUV) in control (Left) or treated (Right) mice. (B) Quantification of 18F-FDG uptake in BAT, visceral WAT, skeletal muscle, and liver. BAT uptake is twofold higher in treated mice vs. controls (Student t test; **P = 0.002). (C) Consecutive (a–c) CT images (Top) in Hounsfield units (HU) show darkened areas of WAT in interscapular adipose tissue. PET images (Middle; SUV) shows that of 18F-FDG uptake is entirely into interscapular BAT (iBAT). The overlay of PET and CT images (Bottom) show that 18F-FDG uptake is entirely into iBAT, with no uptake detected in interscapular WAT (iWAT); n = 6 in each group. All bar graphs depict mean ± SEM.
Fig. 5.
Fig. 5.
ShK-186 therapy alters the metabolite profile of BAT, liver, and WAT. (A) Interscapular BAT; (B) liver; (C) visceral WAT in control and ShK-186–treated mice. Heat map in a three-color range minimum (0.5; bright green), median (1.0, black), and maximum (2.0, red). Welch’s two-sample t tests were used to identify metabolites that differed significantly between ShK-186–treated tissues compared with controls (see SI Materials and Methods for more details about statistical analysis). Metabolites that achieved statistical significance (P ≤ 0.05), as well as those approaching significance (0.05 < P < 0.1), are shown in the columns at the right end of each heat map and are identified by a brown diamond. Metabolites that are significantly altered: red, increased P < 0.05; pink, increased P < 0.1; bright green, decreased P < 0.05; light green, decreased P < 0.1 in ShK-186–treated tissues compared with controls. Raw data are shown in Fig. S3.
Fig. 6.
Fig. 6.
Kv1.3 is expressed in BAT, and ShK-186 therapy activates BAT. (A) mRNA levels in interscapular BAT of key genes involved in BAT metabolism in control (blue bars) and ShK-186–treated mice (brown) determined relative to 18S RNA by qPCR. FAS, fatty acid synthase; GK, glucokinase; Student t test: GK *P = 0.04; FAS *P = 0.02; Elovl6 *P = 0.03; UCP1 *P = 0.04; PPARγ *P = 0.04. All bar graphs depict mean ± SEM. (B) Kv1.3 mRNA in BAT relative to 18S RNA. (C) Western blot showing Kv1.3 in BAT of mice on chow vs. obesity-inducing diet. Actin served as the control. The Kv1.3 bands of 60 kDa (nonglycosylated) and 80 kDa (glycosylated) are the same size as reported (33). Quantitation was performed by densitometry and is shown in Table S8. (D) Immunohistochemistry: Kv1.3 in interscapular BAT (Left), visceral WAT (vWAT; Center), and skeletal muscle (Right). (Insets) Isotype controls (polyclonal rabbit IgG in place of primary antibody). Studies were done at week 10; n = 4 for A, C, and D; n = 7 for B.
Fig. 7.
Fig. 7.
Graphical representation of metabolic pathways altered in BAT following ShK-186 treatment. Metabolites and genes with significantly enhanced expression (P < 0.05) are highlighted in red. The raw data are shown in Figs. 5 and 6, and Fig. S3. Dotted lines represent possible changes that may occur with Kv1.3 channel blockade.
Fig. 8.
Fig. 8.
ShK-186 therapy alters VO2, RER, and EE without altering locomotor activity, calorie intake, or thyroid hormone levels. In all panels, blue represents controls and brown represents ShK-186–treated mice. (A–F) VO2 (A), RER (C), and EE (E) measured over 36 h, and dark-phase and light-phase changes in VO2 (B), RER (D), and EE (F). P values for daily differences between control and treated mice = O2 consumption (repeated-measures two-way ANOVA: P < 0.0001), RER (P = 0.001), and EE (P = 0.0001; Table S4). (G) Body temperature over 36 h, P = 0.0015 at midday. (H) Triiodothyronine (T3; Student t test, P = 0.02) and thyroxine (T4; Student t test, P = 0.04) levels. (I and J) Locomotor activity over 36 h. Fluid (K) and food (L) consumption measured over 36 h. For K, we measured intake of fructose/water in milliliters and calculated the fructose consumption in grams based on the weight-to-volume concentration of fructose, and then quantified dark-phase and light-phase calorie intake from fructose/water (K; P = 0.0006; Table S6) and food (L; P = 0.769; Table S5). (M) Total daily calorie intake was not altered by treatment (P = 0.395; Table S7). Statistical tests: A, C, E, G, I, K, and L: repeated-measures two-way ANOVA; B, D, F, H, J, and M: Student t test was performed to compare means. n = 10 for A–F; n = 11 for K–M; n = 10 for G; n = 6 for I and J. All graphs depict mean ± SEM. Measurements made at week 10 of the study. ShK-186 (500 μg/kg) administered at 5:30 PM before recording.
Fig. 9.
Fig. 9.
Kv1.3 expression is induced in the liver of mice on the obesity diet, and ShK-186 therapy alters energy and lipid metabolism in the liver. (A) Western blot showing Kv1.3 in the liver of mice on chow (lanes 1 and 2) vs. obesity diet (lanes 3 and 4). Actin served as the control. Livers were analyzed at week 10 of the study. Quantitation was performed by densitometry and is shown in Table S9. (B) Kv1.3 immunostaining in hepatocytes in liver from a mouse on the obesity diet. (Inset) Isotype control (polyclonal rabbit IgG in place of primary antibody). (C) Effect of ShK-186 therapy on energy metabolism in the liver; metabolites, or genes altered in expression are highlighted in red (increased P < 0.05), pink (increased P < 0.1), bright green (decreased P < 0.05), and light green (decreased P < 0.1). (D) Effect of ShK-186 therapy on the urea cycle in the liver; same color code as in C. (E) Effect of ShK-186 therapy on lipid metabolism in the liver. EFA, essential fatty acids; G3P, glycerol-3-phosphate; GPC, glycerophosphocholine; LCFA, long-chain fatty acids; VLCFA, very long-chain fatty acids; VLCEFA, very long-chain essential fatty acids; same color code as in C. (F) mRNA levels of phosphoenolpyruvate carboxykinase (PEPCK) and carbamoyl phosphate synthase 1 (CPS1), relative to 18S RNA, was determined by qPCR in livers of control and ShK-186–treated mice (Upper). Student t test; **P < 0.01. Protein levels of CPS1 and AdoHcyase from pooled samples was determined by 2-DIGE-MS (Lower; SI Materials and Methods).
Fig. 10.
Fig. 10.
Graphical representation of changes induced by ShK-186 therapy in the diet-induced obesity model. Mice were fed an obesity-inducing diet of high fat and high fructose. ShK-186 or vehicle was administered by s.c. injection every other day. ShK-186 therapy prevented dyslipidemia, hyperglycemia, insulin resistance, adiposity, and fatty liver in this model. At least three mechanisms were involved in the peptide’s effect: increased BAT-dependent energy expenditure, enhanced energy and lipid metabolism in the liver, and reduced inflammation of WAT.

Comment in

References

    1. Flegal KM, Carroll MD, Ogden CL, Curtin LR. Prevalence and trends in obesity among US adults, 1999–2008. JAMA. 2010;303(3):235–241. - PubMed
    1. Dudina A, et al. SCORE investigators Relationships between body mass index, cardiovascular mortality, and risk factors: A report from the SCORE investigators. Eur J Cardiovasc Prev Rehabil. 2011;18(5):731–742. - PubMed
    1. Huang ES, Basu A, O’Grady M, Capretta JC. Projecting the future diabetes population size and related costs for the U.S. Diabetes Care. 2009;32(12):2225–2229. - PMC - PubMed
    1. Xu J, et al. The voltage-gated potassium channel Kv1.3 regulates energy homeostasis and body weight. Hum Mol Genet. 2003;12(5):551–559. - PubMed
    1. Tucker K, Overton JM, Fadool DA. Diet-induced obesity resistance of Kv1.3−/− mice is olfactory bulb dependent. J Neuroendocrinol. 2012;24(8):1087–1095. - PMC - PubMed

Publication types

MeSH terms