. 2013 Jul 1:244:4-21.
doi: 10.1016/j.jcp.2012.09.015.

Patient-Specific Models of Cardiac Biomechanics

Affiliations

Patient-Specific Models of Cardiac Biomechanics

Adarsh Krishnamurthy et al. J Comput Phys. .

Abstract

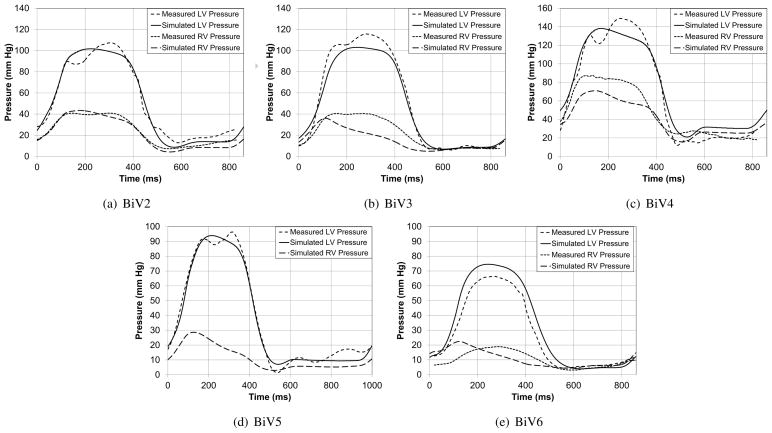
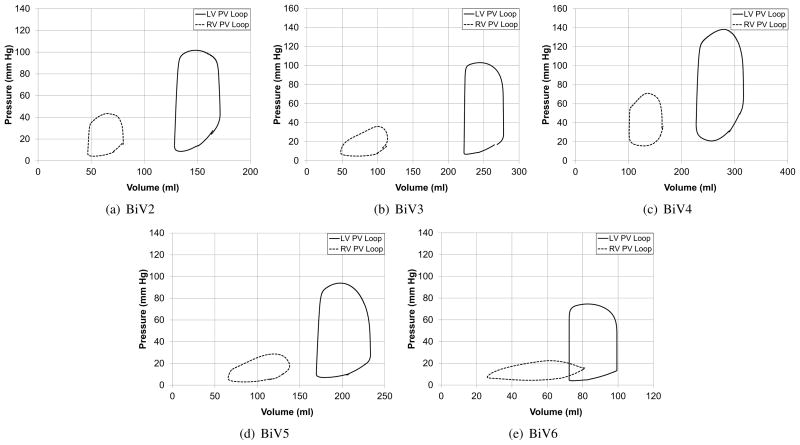
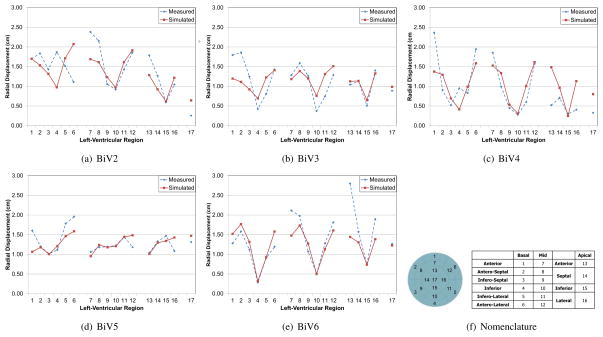
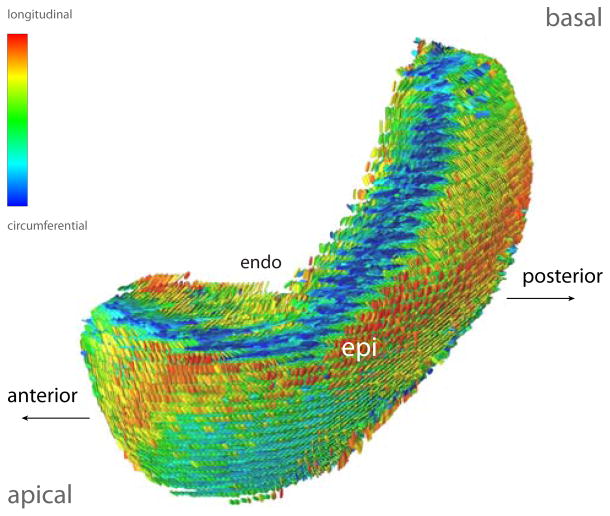
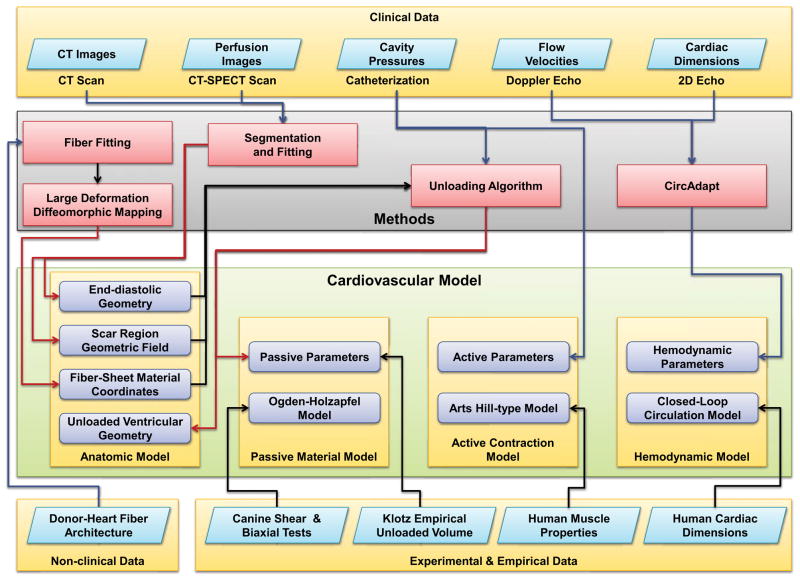
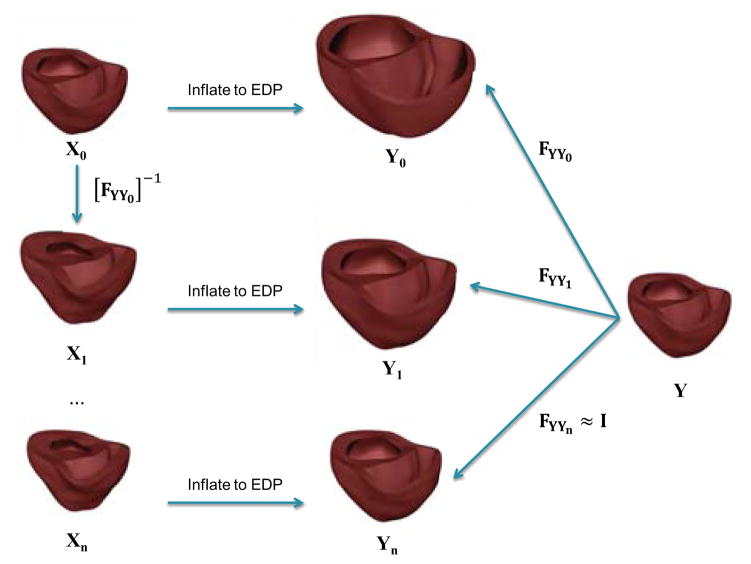
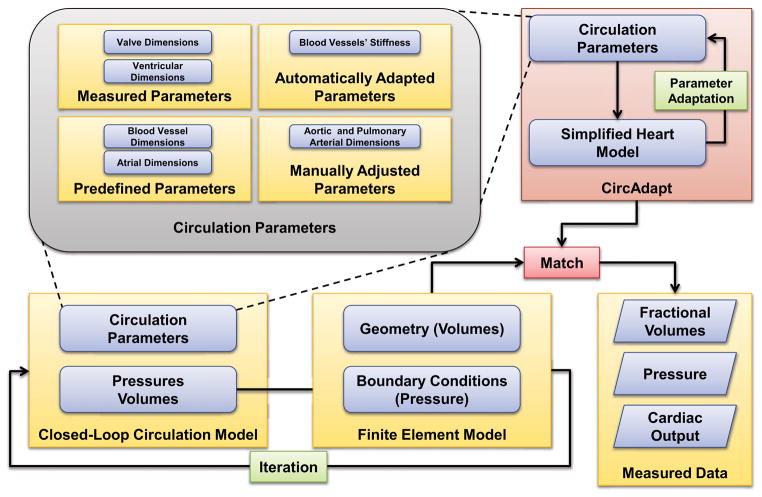
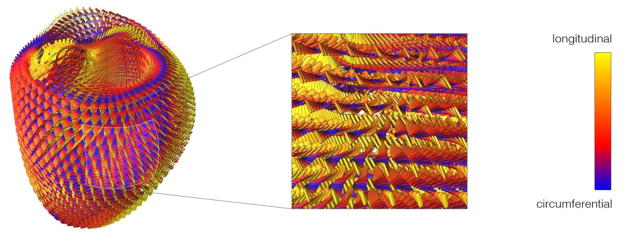
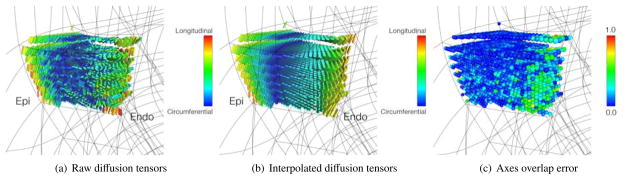
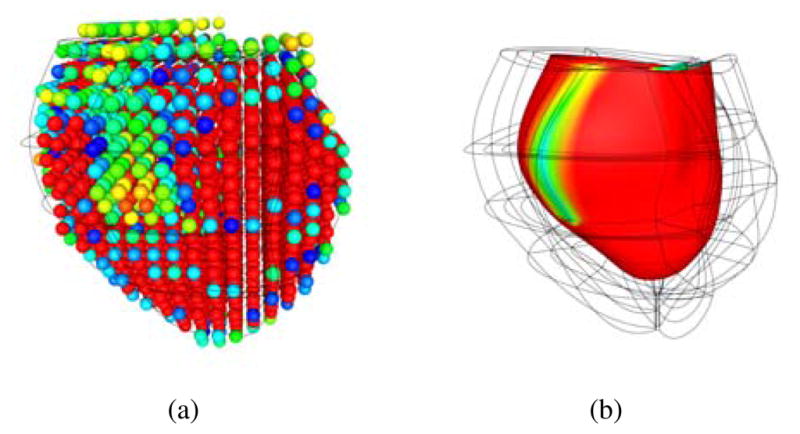
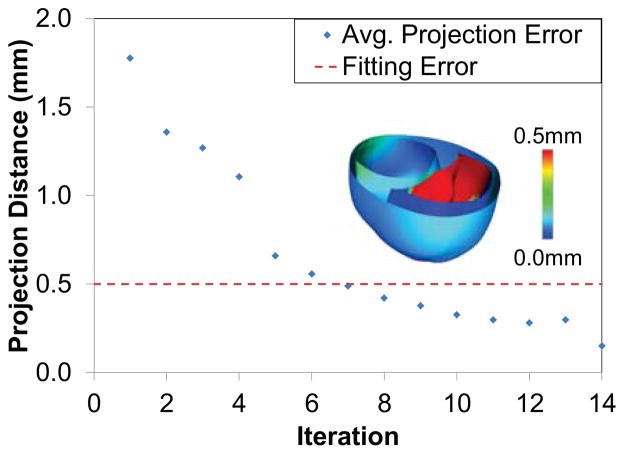
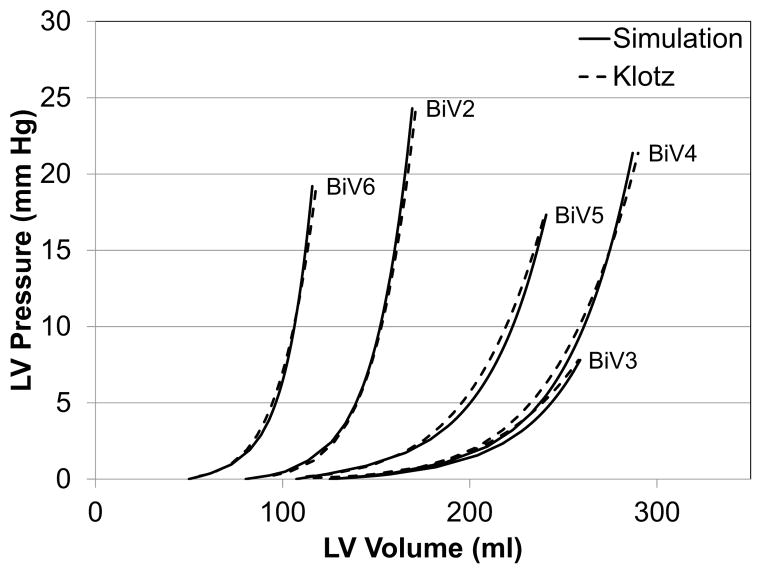
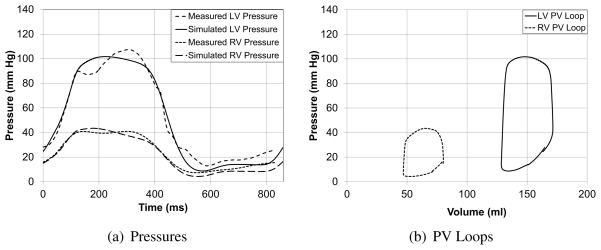
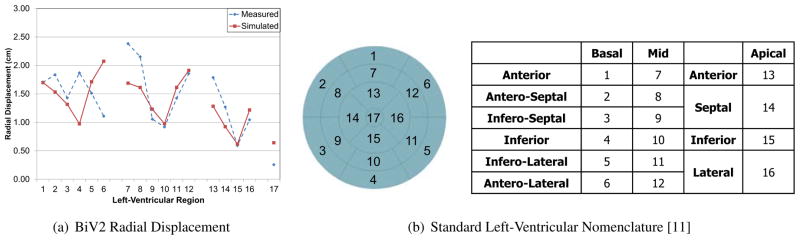
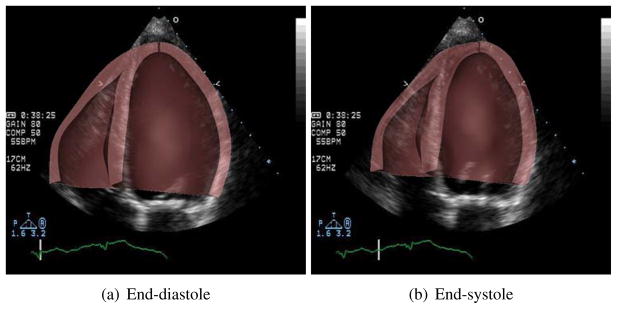
Patient-specific models of cardiac function have the potential to improve diagnosis and management of heart disease by integrating medical images with heterogeneous clinical measurements subject to constraints imposed by physical first principles and prior experimental knowledge. We describe new methods for creating three-dimensional patient-specific models of ventricular biomechanics in the failing heart. Three-dimensional bi-ventricular geometry is segmented from cardiac CT images at end-diastole from patients with heart failure. Human myofiber and sheet architecture is modeled using eigenvectors computed from diffusion tensor MR images from an isolated, fixed human organ-donor heart and transformed to the patient-specific geometric model using large deformation diffeomorphic mapping. Semi-automated methods were developed for optimizing the passive material properties while simultaneously computing the unloaded reference geometry of the ventricles for stress analysis. Material properties of active cardiac muscle contraction were optimized to match ventricular pressures measured by cardiac catheterization, and parameters of a lumped-parameter closed-loop model of the circulation were estimated with a circulatory adaptation algorithm making use of information derived from echocardiography. These components were then integrated to create a multi-scale model of the patient-specific heart. These methods were tested in five heart failure patients from the San Diego Veteran's Affairs Medical Center who gave informed consent. The simulation results showed good agreement with measured echocardiographic and global functional parameters such as ejection fraction and peak cavity pressures.

Keywords: Cardiac Biomechanics; Fiber Architecture; Finite Elements; Heart Failure; Patient-specific Models; Unloaded Geometry.


Figures

Figure A.16
Figure A.16
Diffusion tensor error metrics to assess the quality of the fitted diffusion tensor field compared to original measurements.
Figure B.17
Figure B.17
Comparison of the measured and simulated LV and RV cavity pressures in the five patients. The RV measurement in patient BiV5 was not reliable due to fluctuations in the measurements.
Figure B.18
Figure B.18
Pressure-volume loops for the five patient-specific models.
Figure B.19
Figure B.19
Radial displacement between end-diastole and end-systole from the measured and simulated geometries at different locations of the left-ventricle.
Figure 1
Figure 1
A section of the reconstructed diffusion tensors in the LV lateral wall of the explanted donor heart. An individual tensor is represented by a glyph that is oriented in the principal directions (eigenvectors) of diffusion. The long axis of the glyph represents the fiber direction, and the glyph plane represents the fiber-sheet plane. The glyph axes are scaled by the normalized magnitude (eigenvalues) of diffusion along each principal axis. The glyph surfaces are colored based on the orientation of the fiber axis with respect to the circumferential axis.
Figure 2
Figure 2
Different components of the patient-specific cardiovascular model and the various methods and data used in developing the model.
Figure 3
Figure 3
Two views of the fitted anatomic model of the host heart with 2 reconstructed slices from the DT-MRI scan aligned to it before fitting the tensor component fields. The slices were precisely aligned with the anatomic model of the host heart and the tensors were rotated to account for the alignment.
Figure 4
Figure 4
Two views of the results of the large deformation diffeomorphic mapping and the tensor reorientation strategy from the host to a target patient (BiV4). The interpolated fiber architecture is shown in four transmural elements in the LV lateral wall. The fiber-sheets were reoriented using the PPD strategy by computing the deformation gradient F(Y) between corresponding material points in the host and the patient anatomical models.
Figure 5
Figure 5
Algorithm to find the unloaded geometry. The initial geometry, X0, is first inflated to the measured end-diastolic pressure. The deformation gradient between the inflated mesh (Y0) and the fitted end-diastolic (Y) is then computed. This deformation gradient is then applied inversely to the initial estimate to get a new unloaded geometry estimate. This process is iterated until the projection error between the surfaces of the measured and loaded geometries is lower than the fitting error.
Figure 6
Figure 6
Interaction between the circulation model and the finite-element ventricular model. Some of the circulation parameters that were measured in the patient are used directly. Then certain parameters are adjusted manually to match parameters such as end-diastolic and end-systolic pressures. The CircAdapt algorithm is used to estimate the remaining circulation parameters subject to constraints of cardiac output and mean aortic pressure. Finally, the adapted parameters are used in the circulation model coupled to finite element model. This process is iterated until the simulation results match the measured values.
Figure 7
Figure 7
Lateral view of modeled fiber architecture fitted from DT-MRI measurements in a bi-ventricular model of the host heart. The diffusion tensors are represented as scaled glyphs depicting the orientation of the myofiber-sheet structure. The glyphs are colored according to their z-axis component. A close-up of lateral wall of the left ventricle reveals the well-established characteristic organization of the fibers through the thickness of the wall.
Figure 8
Figure 8
Distribution of the overlap error tensor metric between the measured and modeled material axes at corresponding locations in the model. Regions with poor overlap are marked in the bi-ventricular host mesh on the right.
Figure 9
Figure 9
(a) Raw diffusion tensor data in four transmural elements located in the LV lateral wall. (b) Interpolated diffusion tensors from the fit of the log-Euclidean components. (c) Degree of overlap between (a) and (b). Points of high overlap are colored blue; points of lower overlap are colored green. Note the fit smoothing achieved by linear interpolation of the DT components.
Figure 10
Figure 10
(a) The voxel intensities of the MIBI scan were reconstructed in 3D space and aligned to the anatomical model of the ventricles. (b) A scalar field was fitted to the voxel intensities to define the region of the scar on the posterior left ventricular lateral wall running from base to mid-ventricle in BiV4.
Figure 11
Figure 11
The error in the unloading algorithm is measured using the average projection distance between the points on the surface of the fitted end-diastolic mesh and the loaded mesh. This error reaches a value lower than the fitting error within a few iterations. The inset figure shows the regional distribution of the error.
Figure 12
Figure 12
End-diastolic pressure-volume relationships for five different patient specific models. The dotted lines represent the shape of the curve using Klotz’s empirical relationship. The chosen model and material parameters were able to reproduce the fitted curves.
Figure 13
Figure 13
Comparison of the measured and simulated LV and RV cavity pressures and pressure-volume loops for one of the patients. Individual plots are included in the Appendix.
Figure 14
Figure 14
Radial displacement between end-diastole and end-systole from the measured and simulated geometries at different locations of the left-ventricle for one of the patients. The radial displacement in the simulated model closely matches the values obtained from models fitted to echocardiographic images.
Figure 15
Figure 15
Comparison of ventricular geometry of the simulated heart (brown), overlaid on the clinical echocardiographic images of the same heart at end-diastole and end-systole.

References

    1. Aguado-Sierra J, Krishnamurthy A, Villongco C, Chuang J, Howard E, Gonzales M, Omens J, Krummen D, Narayan S, Kerckhoffs R, et al. Patient-specific modeling of dyssynchronous heart failure: A case study. Progress in Biophysics and Molecular Biology 2011 - PMC - PubMed
    1. Alastrue V, Garía A, Peña E, Rodríguez J, Martínez M, Doblaré M. Numerical framework for patient-specific computational modelling of vascular tissue. International Journal for Numerical Methods in Biomedical Engineering. 2010;26 (1):35–51.
    1. Alexander A, Hasan K, Kindlmann G, Parker D, Tsuruda J. A geometric analysis of diffusion tensor measurements of the human brain. Magnetic Resonance in Medicine. 2000;44 (2):283–291. - PubMed
    1. Alexander D, Pierpaoli C, Basser P, Gee J. Spatial transformations of diffusion tensor magnetic resonance images. Medical Imaging, IEEE Transactions on. 2001;20 (11):1131–1139. - PubMed
    1. Arsigny V, Fillard P, Pennec X, Ayache N. Fast and simple calculus on tensors in the log-euclidean framework. Medical Image Computing and Computer-Assisted Intervention–MICCAI. 2005;2005:115–122. - PubMed