

Methodological Guidelines for Reducing the Complexity of Data Warehouse Development for Transactional Blood Bank Systems
- PMID: 23729945
- PMCID: PMC3665424
- DOI: 10.1016/j.dss.2013.02.008
Methodological Guidelines for Reducing the Complexity of Data Warehouse Development for Transactional Blood Bank Systems
Abstract
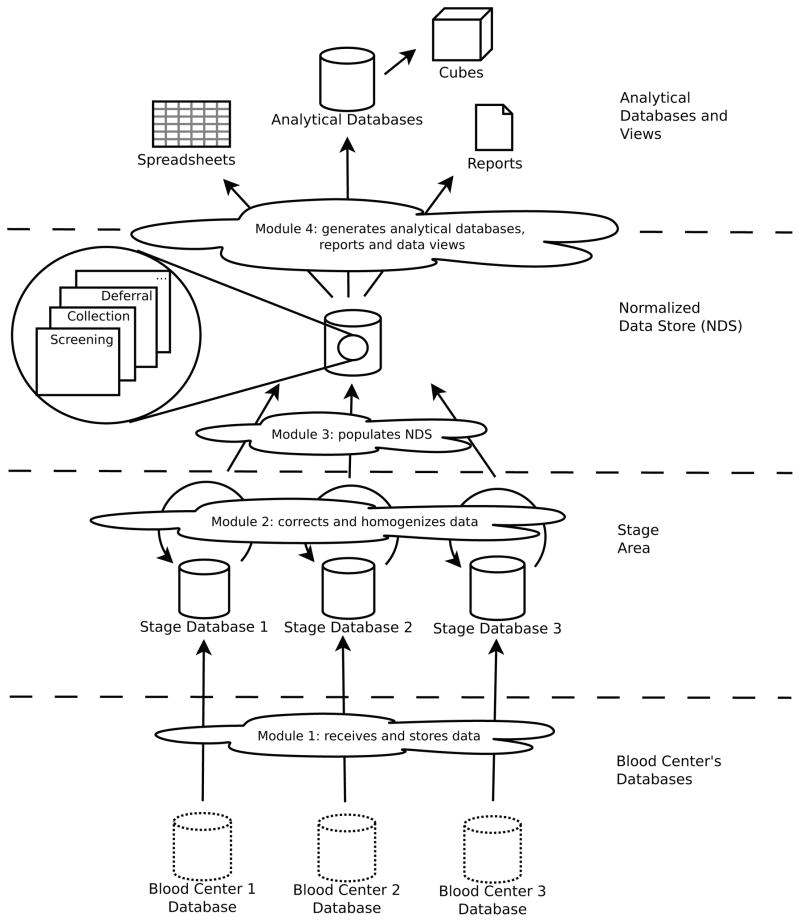
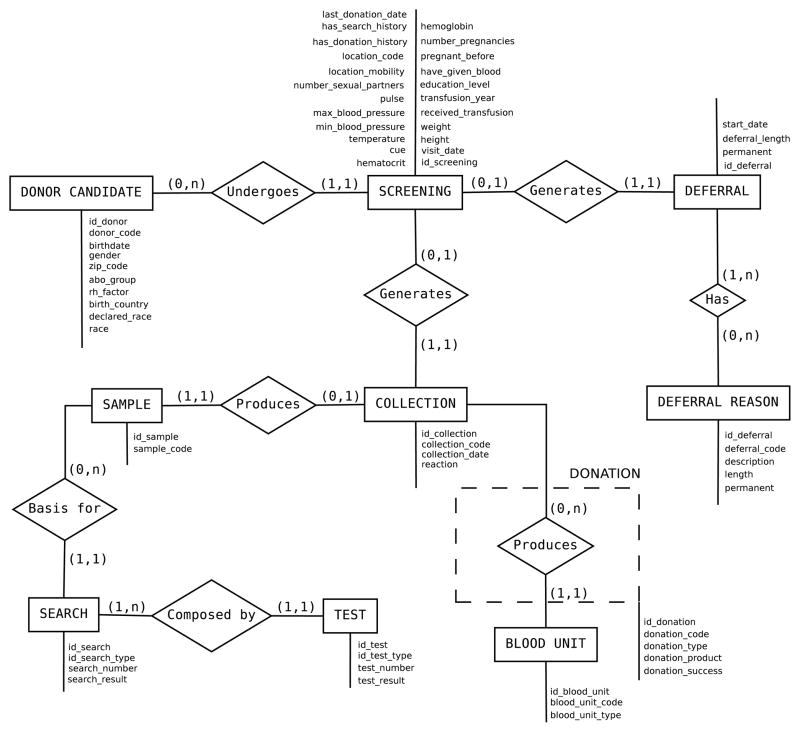
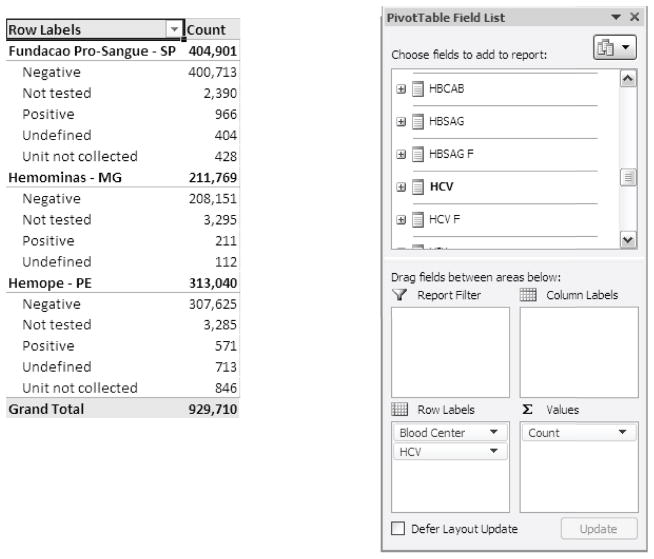
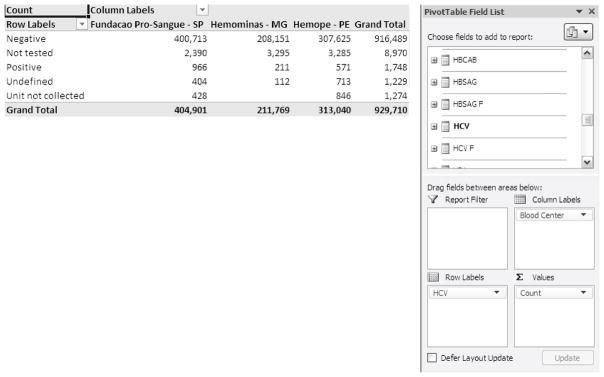
Over time, data warehouse (DW) systems have become more difficult to develop because of the growing heterogeneity of data sources. Despite advances in research and technology, DW projects are still too slow for pragmatic results to be generated. Here, we address the following question: how can the complexity of DW development for integration of heterogeneous transactional information systems be reduced? To answer this, we proposed methodological guidelines based on cycles of conceptual modeling and data analysis, to drive construction of a modular DW system. These guidelines were applied to the blood donation domain, successfully reducing the complexity of DW development.
Keywords: blood donation process; conceptual modeling; data analysis; data warehouse; heterogeneous systems; modular architecture.
Figures

References
-
- [Accessed on 14-Feb-2013.];BIOLAP. 2012 http://biolap.sourceforge.net/)
-
- [Accessed on 14-Feb-2013.];CA ERwin Data Modeling. 2012 http://erwin.com/
-
- [Accessed on 14-Feb-2013.];Microsoft Excel. 2012 http://office.microsoft.com/en-us/excel/
-
- [Accessed on 14-Feb-2013.];Pentaho Mondrian Project. 2012 http://mondrian.pentaho.com/
-
- [Accessed on 14-Feb-2013.];SAP Sybase PowerDesigner. 2012 http://www.sybase.com/products/modelingdevelopment/powerdesigner/
Grants and funding
LinkOut - more resources
Full Text Sources
Other Literature Sources