. 2013 Jun 1;1(2):102-114.
doi: 10.1007/s40134-013-0010-3.

Chemical Exchange Saturation Transfer (CEST) Imaging: Description of Technique and Potential Clinical Applications

Affiliations

Chemical Exchange Saturation Transfer (CEST) Imaging: Description of Technique and Potential Clinical Applications

Feliks Kogan et al. Curr Radiol Rep. .

Abstract

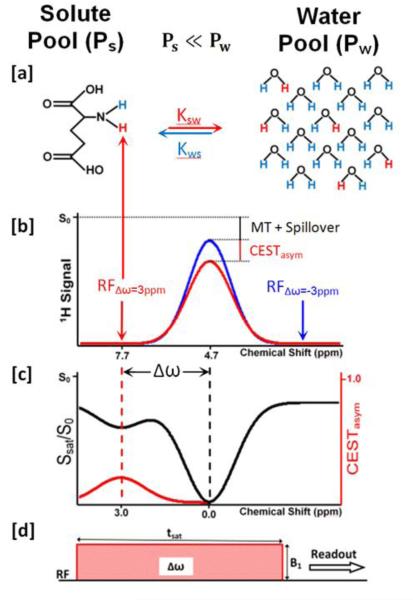
Chemical exchange saturation transfer (CEST) is a magnetic resonance imaging (MRI) contrast enhancement technique that enables indirect detection of metabolites with exchangeable protons. Endogenous metabolites with exchangeable protons including many endogenous proteins with amide protons, glycosaminoglycans (GAG), glycogen, myo-inositol (MI), glutamate (Glu), creatine (Cr) and several others have been identified as potential in vivo endogenous CEST agents. These endogenous CEST agents can be exploited as non-invasive and non-ionizing biomarkers of disease diagnosis and treatment monitoring. This review focuses on the recent technical developments in endogenous in vivo CEST MRI from various metabolites as well as their potential clinical applications. The basic underlying principles of CEST, its potential limitations and new techniques to mitigate them are discussed.

Keywords: APT; CEST; Chemical Exchange; GluCEST; MRI; Molecular Imaging.


Figures

Figure 1
Figure 1
Chemical exchange saturation transfer (CEST) contrast enhancement mechanism illustrated with a two-site exchange between a solute pool and a solvent pool (water). (a) Radiofrequency (RF) saturation applied at the resonance frequency (Δω) of the labile solute protons (Ps) leads to a loss of net magnetization. These saturated protons (red) from the solute pool then exchange with unsaturated protons (blue) from the much larger water pool (Pw) with an exchange rate, ksw leading to an accumulation of saturated protons in the water pool. (b) The accumulation of the zero net magnetization of solute protons in water results in a decrease in the total water signal. While the saturation pulse is being applied, this process continues to decrease the water magnetization through the CEST effect as well as through magnetization transfer (MT) and direct water saturation or “spillover” effects. A saturation pulse applied at the corresponding reference frequency symmetrically at the opposite side of the water resonance (−Δω) will decrease the water magnetization through MT and spillover effects only. (c) Saturation transfer effects can be assessed using a z-spectrum (black curve) where the water signal is plotted as a function of saturation frequency. Here the water resonance frequency is used as the center frequency and assigned the chemical shift of 0 ppm as opposed to in NMR spectra, where water protons have a chemical shift of 4.7 ppm. Asymmetry analysis (CESTasym) is performed by subtracting the water signal from one side of the z-spectrum from the other side to mitigate the effects of spillover as well MT effects and isolate the effects of chemical exchange. (d) Standard CEST magnetization preparation consisting of a long saturation pulse applied at a resonance frequency, Δω, at a saturation amplitude, B1, and duration tsat. The saturation pulse can be a single, long frequency selective rectangular pulse, as shown here or a train of shaped frequency selective pulses separated by small delays.
Figure 2
Figure 2
Comparison of active tumors and radiation necrosis using APT MRI and histology. (a) Gadolinium (Gd) enhanced and APT MRI and H&E-stained histopathological sections of (a) radiation necrosis (black arrowhead), (b) SF188/V+ human glioma tumor (pink open arrow), and (c) 9L gliosarcoma tumor (red open arrow). All three lesions appear hyperintense compared to contralateral brain tissue in Gd-enhanced MR imaging. However, on APT maps, active tumors appear hyperintense while radiation necrosis is hypointense to isointense. This corresponds to the high cellularity seen in histology of active tumors compared to radiation necrosis. (d) Quantitative comparison of APT image intensities (in percentage change of bulk water signal intensity) for radiation necrosis and active gliomas. Radiation necrosis and active tumors have opposite APT signal intensities with respect to the control contralateral brain tissue. (From [34•], with permission.)
Figure 3
Figure 3
B0 and B1 corrected GagCEST maps of human knee cartilage at (a) 3T and (b) 7T. (c) GagCEST asymmetry plot simulations at 3T and 7T [Singh et al. Mag. Res. Med. 2011]. High-spatial-resolution (d) morphologic, (e) GagCEST, and (f) 23Na MR images of the knee joint cartilage of a patient (26.4 years old) who underwent matrix-associated autologous chondrocyte transplantation (MACT) in the lateral femoral condyle. (From [43], with permission.)
Figure 4
Figure 4
MICEST maps show the distribution of myo-Inositol in the brain of a (a) 20 months old wild type mouse and a (b) 20 month old APP-PS1 transgenic mouse model of Alzheimer’s disease (AD). Higher MICEST contrast is depicted in the AD brain compared to the WT mouse. 1H MRS spectrum shows that compared to the (c) wild type mouse, there was an increase in the myo-inositol peak amplitude in the (d) AD mouse. GFAP immunostain of brain slices from (e) WT and (f) APP-PS1 mice show higher expression of GFAP in the APP-PS1 mouse than the WT mouse. This signifies higher glial cell proliferation/activation in APP-PS1 mice. (From [48], with permission.)
Figure 5
Figure 5
GluCESTasym maps of an ischemic rat brain model. (a) Rat brain anatomic proton image. (b,c) The GluCESTasym maps of the rat brain acquired at 1 h and 4.5 h following the induction of stroke. (d) The plot of GluCESTasym vs. time after MCAO at regions of interest within the rectangular areas shown in (c). In the ipsilateral side GluCESTasym is almost doubled at 4.5 h after occlusion. (e) The GluCESTasym plots from the contralateral side (blue curve) and ipsilateral side (red curve). (From [52•], with permission.)
Figure 6
Figure 6
(a) CrCESTasym maps of a human lower leg before and after plantar flexion exercise. (b) The plot of 31P MRS PCr peak integral as a function of time before and after exercise. (c) The plot of the average CrCESTasym as a function of time in a region of interest selected to correlate to the depth of penetration of the 31P MRS surface coil (unpublished results from author’s laboratory).
Figure 7
Figure 7
In vivo imaging of lysine rich protein (LRP). (a) Anatomical image and (b) CEST signal intensity–difference map overlaid on the anatomical image distinguishes between LRP-expressing and control xenografts. (From [69], with permission.)

References

    1. Ametamey SM, Treyer V, Streffer J, et al. Human PET studies of metabotropic glutamate receptor subtype 5 with C-11-ABP688. J Nuc Med. 2007;48(2):247–252. - PubMed
    1. Dunn WB, Ellis DI. Metabolomics: Current analytical platforms and methodologies. Trac-Trend Anal Chem. 2005;24(4):285–294.
    1. Burt CT, Glonek T, Barany M. Analysis of phosphate metabolites, intracellular pH, and state of adenosine-triphosphate in intact muscle by phosphorus nuclear magnetic-resonance. J Biol Chem. 1976;251(9):2584–2591. - PubMed
    1. Kreis R, Ernst T, Ross BD. Absolute quantitation of water and metabolites in the human brain .2. Metabolite concentrations. J Magn Reson Ser B. 1993;102(1):1–19.
    1. Provencher SW. Estimation of metabolite concentrations from localized in-vivo proton NMR spectra. Magn Reson Med. 1993;30(6):672–679. - PubMed