. 2013 May 17:3:97.
doi: 10.3389/fonc.2013.00097. eCollection 2013.

Ovarian tumor attachment, invasion, and vascularization reflect unique microenvironments in the peritoneum: insights from xenograft and mathematical models

Affiliations

Ovarian tumor attachment, invasion, and vascularization reflect unique microenvironments in the peritoneum: insights from xenograft and mathematical models

Mara P Steinkamp et al. Front Oncol. .

Abstract

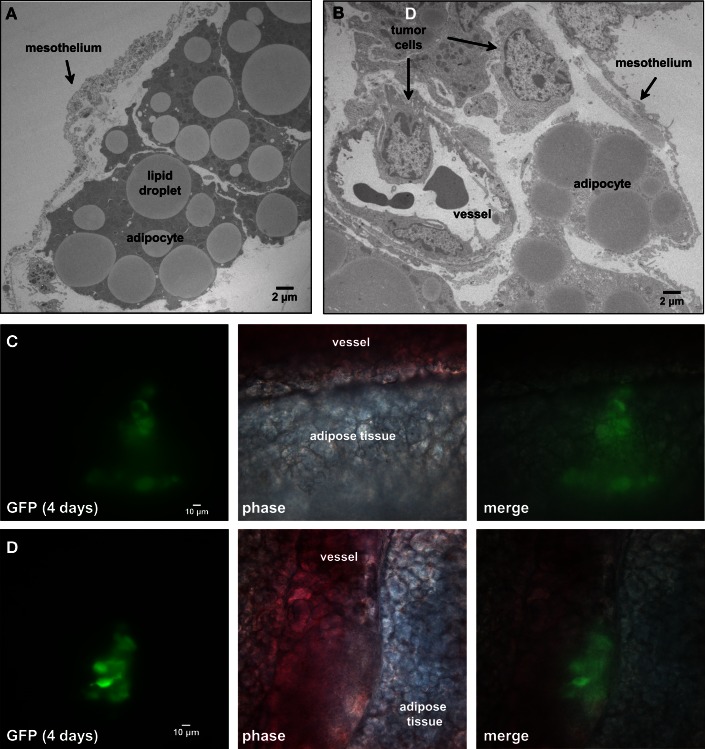
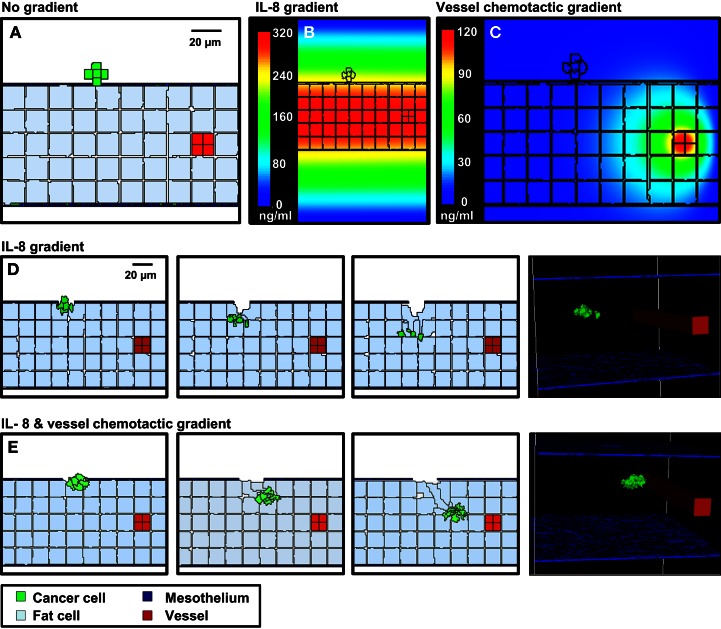
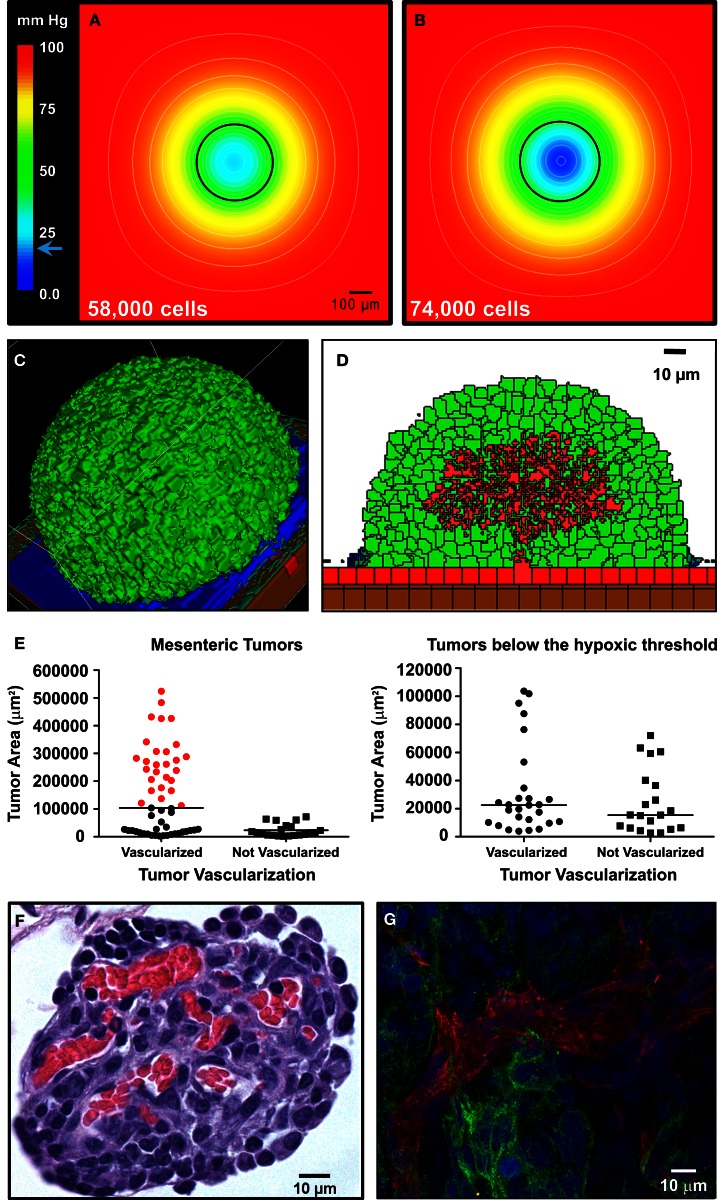
Ovarian cancer relapse is often characterized by metastatic spread throughout the peritoneal cavity with tumors attached to multiple organs. In this study, interaction of ovarian cancer cells with the peritoneal tumor microenvironment was evaluated in a xenograft model based on intraperitoneal injection of fluorescent SKOV3.ip1 ovarian cancer cells. Intra-vital microscopy of mixed GFP-red fluorescent protein (RFP) cell populations injected into the peritoneum demonstrated that cancer cells aggregate and attach as mixed spheroids, emphasizing the importance of homotypic adhesion in tumor formation. Electron microscopy provided high resolution structural information about local attachment sites. Experimental measurements from the mouse model were used to build a three-dimensional cellular Potts ovarian tumor model (OvTM) that examines ovarian cancer cell attachment, chemotaxis, growth, and vascularization. OvTM simulations provide insight into the relative influence of cancer cell-cell adhesion, oxygen availability, and local architecture on tumor growth and morphology. Notably, tumors on the mesentery, omentum, or spleen readily invade the "open" architecture, while tumors attached to the gut encounter barriers that restrict invasion and instead rapidly expand into the peritoneal space. Simulations suggest that rapid neovascularization of SKOV3.ip1 tumors is triggered by constitutive release of angiogenic factors in the absence of hypoxia. This research highlights the importance of cellular adhesion and tumor microenvironment in the seeding of secondary ovarian tumors on diverse organs within the peritoneal cavity. Results of the OvTM simulations indicate that invasion is strongly influenced by features underlying the mesothelial lining at different sites, but is also affected by local production of chemotactic factors. The integrated in vivo mouse model and computer simulations provide a unique platform for evaluating targeted therapies for ovarian cancer relapse.

Keywords: angiogenesis; cell adhesion; cellular Potts model; chemotaxis; metastasis; ovarian cancer; tumor microenvironment; tumor modeling.


Figures

Figure 1
Figure 1
SKOV3.ip1-GFP cells colonize the surface of many organs in the mouse peritoneum. (A) Image of SKOV3.ip1 tumors growing from the omentum (large central tumor, arrowhead), the intestine, attached mesentery (white arrows), and the liver (yellow arrow) of an RFP nude mouse. Tumors on the spleen are not visible in this image. (B) The largest tumors are attached to the omentum located on the larger curvature of the stomach and are well vascularized. (C) Tumors attached to the stomach are spherical and non-invasive. (D) On the mesentery, small tumors are located adjacent to major blood vessels (arrow). (E) Small tumors growing on the spleen have a flatter, sponge-like morphology with less well defined borders between the tumor (green) and the normal tissue.
Figure 2
Figure 2
Co-injected SKOV3.ip1-GFP and RFP cells yield chimeric tumors. Equal numbers of SKOV3.ip1-GFP and SKOV3.ip1-RFP cells were injected as a single-cell suspension into the peritoneum of nude mice. (A–C) Large tumors on the omentum are both GFP-positive (GFP-filter) (A) and RFP-positive (RFP-filter) (B). White boxes: magnified region shown in (C). (C) A 5X magnified composite image of the tumor from (A,B) showing a mixture of GFP- and RFP-positive cells. (D,E) Chimeric tumors on the mesentery have patches of green and red fluorescence. A clonal tumor that is only GFP-positive can be seen (E), (arrow). (F) Endpoint of a mathematical simulation initialized with a mixed GFP/RFP spheroid of 56 cells attached to the mesothelial surface of the intestine. A 180 × 180 × 180 μm lattice (5.832 mm3) is partitioned into layers of smooth muscle (brown), extracellular matrix fibers (teal), mesothelium (dark blue), and vessel (red) creating a 0.84 mm3 tissue layer. Above the tissue is peritoneal fluid. The 3-D image shows a chimeric tumor (orange and green cells) after 7 days of growth.
Figure 3
Figure 3
SKOV3.ip1-GFP and RFP cells injected sequentially emphasize the importance of tumor cell-cell adhesion. About 2.5 million SKOV3.ip1-GFP cells were injected into nude mice and allowed to grow for 1 week before injection of an equal number of SKOV3.ip1-RFP cells. Tumors were imaged 1 week later. (A) SKOV3.ip1-RFP cells preferentially adhere to and coat existing GFP-positive tumors on the omentum. (B) Similar to the omentum, SKOV3.ip1-RFP cells preferentially adhere to existing GFP-positive tumors on the spleen. (C) On the mesentery, RFP-positive cells form new tumors (white arrows) as well as adhering to existing tumors. Int, small intestine (autofluorescent).
Figure 4
Figure 4
Four days post-injection, tumor cells have invaded the mesentery and migrated through adipose tissue to approach mesenteric blood vessels. (A) Transmission electron micrograph of the edge of the mesentery from a nude mouse. The mesentery architecture is open with loosely connected adipose cells below the mesothelium. Adipocytes are identified by their large lipid droplets. (B) Transmission electron micrograph of mesentery excised 4 days post-injection of SKOV3.ip1 cells. Arrows mark the locations of probable cancer cells. The cancer cells lie close to a blood vessel. (C) Cancer cells invading mesenteric adipose tissue adjacent to a vessel. On the right, GFP fluorescence of the cancer cells; middle, brightfield; left, composite image. (D) Cancer cells closely opposed to a mesenteric vessel. Panels are arranged as in (C).
Figure 5
Figure 5
3-D simulations of cancer cell attachment and migration to the mesenteric vessel. (A) The initial configuration of the simulation has a seven-cell spheroid attached to the surface of the mesentery. To model this environment, a 170 × 170 × 263 μm lattice (7.6 mm3) is partitioned into five layers of adipocytes (light blue) sandwiched between single layers of mesothelium (dark blue) and ECM (teal) creating a 2.6 mm3 tissue layer surrounded by peritoneal fluid. A blood vessel on the right is represented by a solid rod (red). In the absence of chemotactic signals, the spheroid penetrates only the thin mesothelial layer at 1–2 min of simulation. (B,C) Steady-state distributions of chemotactic factors tested in these simulations. The color scale represents variation in factor concentrations in ng/ml. (B) The IL-8 gradient created by secretion of IL-8 from adipocytes. (C) A chemotactic gradient based on secretion of a hypothetical chemotactic factor (Chemotactic Factor 2) from mesenteric vessels. (D) Sequences in the simulation where a chemotactic gradient based on IL-8 is originating from the adipocytes. The spheroid migrates toward the center of the adipose layer. (E) Sequences of a simulation where chemotactic signals originate from both the adipocytes and the vessel. The spheroid migrates through the adipose layer toward the vessel.
Figure 6
Figure 6
Tumors that adhere to the walls of the small intestine are spherical and non-invasive. (A) An SKOV3.ip1-GFP tumor adhering to the wall of the small intestine 2 weeks post-injection in an RFP nude mouse. Shown is a composite GFP/RFP image. Small vessels are visible on the surface of the tumor. (B) Higher magnification image of the vascular tree infiltrating a green-fluorescent tumor on the intestine. (C) Transmission electron micrograph of the small intestine wall. Tissue was collected from a nude mouse 4 days post-injection with SKOV3.ip1-GFP cells. The wall of the small intestine consists of a thin layer of mesothelium overlaying bundles of smooth muscle fibers. (D) TEM image of stomach ultrastructure, illustrating the distinct cellular layers. (E) An H&E-stained section of a tumor attached to the small intestine. There is a clear delineation between the intestine and the tumor. The tumor is vascularized (red arrowhead). (F). An H&E-stained section of the surface of a mouse intestine. Arrow points to vessels at the intestine-mesentery junction.
Figure 7
Figure 7
Vascularization of tumors is rapid and can be attributed to constitutive release of angiogenic factors by SKOV3.ip1 cells. (A,B) Representations of the steady-state oxygen gradients from coarse-grained simulations of spheroids suspended in peritoneal fluid. The color scale indicates the range of oxygen concentrations in mm Hg. Black circles mark the perimeter of the spheroids. (A) The oxygen gradient through the middle of a spheroid 336 μm in diameter (58,000 cells). At this size, all cells are well oxygenated with an oxygen partial pressure above the hypoxic threshold of 19 mm Hg (indicated on the color scale as a blue arrow). The lowest oxygen concentration at the core of the spheroid is 21.6 mm Hg. (B) The oxygen gradient through the middle of a spheroid 364 μm in diameter (74,000 cells). By the time a spheroid has reached this size, the core is hypoxic (0.5 mm Hg). (C,D) OvTM simulations of angiogenesis in a tumor attached to the intestinal wall, assuming constitutive release of VEGF from cancer cells. (C) 3-D image of the simulation after 7.8 days when the tumor has grown to 6,400 cells. (D) 2-D slice through the middle of the tumor in (D) to show vessel tree morphology. (E) Scatter dot plots of mesenteric tumor vascularization with respect to cross-sectional tumor area as determined from H&E-stained sections of mouse intestine and mesentery collected 3 weeks post-injection. Areas of all mesenteric tumors measured are plotted on the left. Tumors with areas above the predicted hypoxic threshold are in red. All non-vascularized tumors fall below the hypoxic threshold. The right plot shows the area and vascularization status of small tumors that fall below the hypoxic threshold. A majority of these small tumors (57%) are also vascularized. Lines indicate the median value. (F) Cross-sectional view of a small mesenteric tumor after H&E staining. Red blood cells (red) can be seen populating vessels within the tumor (blue). (G) Confocal image of ovarian tumor removed from the surface of the gut and labeled with anti-CD31 antibody (endothelial cell marker, red fluorescence) to distinguish tumor vasculature. An anti-GFP antibody with an FITC-labeled secondary antibody marks GFP-expressing cancer cells; Hoechst (blue fluorescence) labels the nuclei of all cells in the field of view.

Similar articles

Cited by

References

    1. Arakelyan L., Merbl Y., Agur Z. (2005). Vessel maturation effects on tumour growth: validation of a computer model in implanted human ovarian carcinoma spheroids. Eur. J. Cancer 41, 159–16710.1016/j.ejca.2004.09.012 - DOI - PubMed
    1. Ausprunk D. H., Folkman J. (1977). Migration and proliferation of endothelial cells in preformed and newly formed blood vessels during tumor angiogenesis. Microvasc. Res. 14, 53–6510.1016/0026-2862(77)90141-8 - DOI - PubMed
    1. Bagley R. G., Walter-Yohrling J., Cao X., Weber W., Simons B., Cook B. P., et al. (2003). Endothelial precursor cells as a model of tumor endothelium. Cancer Res. 63, 5866–5873 - PubMed
    1. Barcz E., Skopinska Rózewska E., Kaminski P., Demkow U., Bobrowska K., Marianowski L. (2002). Angiogenic activity and IL-8 concentrations in peritoneal fluid and sera in endometriosis. Int. J. Gynaecol. Obstet. 79, 229–23510.1016/S0020-7292(02)00308-9 - DOI - PubMed
    1. Bast R. C., Hennessy B., Mills G. B. (2009). The biology of ovarian cancer: new opportunities for translation. Nat. Rev. Cancer 9, 415–42810.1038/nrc2644 - DOI - PMC - PubMed

LinkOut - more resources