

HR-MAS NMR tissue metabolomic signatures cross-validated by mass spectrometry distinguish bladder cancer from benign disease
- PMID: 23731241
- PMCID: PMC3722911
- DOI: 10.1021/pr4004135
HR-MAS NMR tissue metabolomic signatures cross-validated by mass spectrometry distinguish bladder cancer from benign disease
Abstract
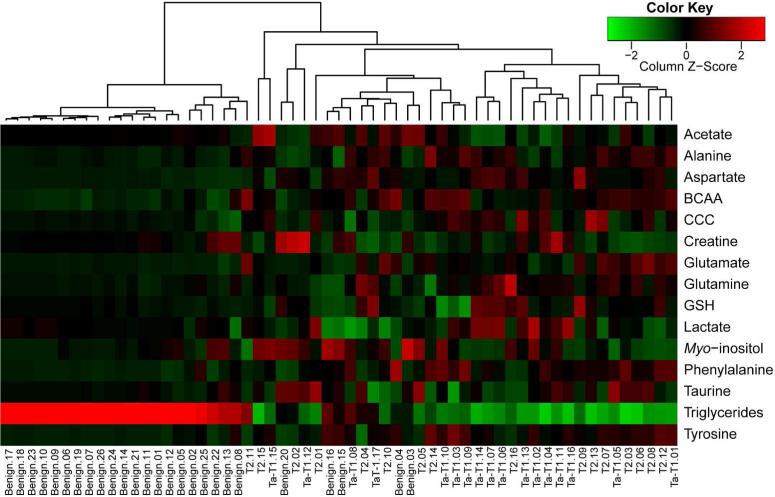
Effective diagnosis and surveillance of bladder cancer (BCa) is currently challenged by detection methods that are of poor sensitivity, particularly for low-grade tumors, resulting in unnecessary invasive procedures and economic burden. We performed HR-MAS NMR-based global metabolomic profiling and applied unsupervised principal component analysis (PCA) and hierarchical clustering performed on NMR data set of bladder-derived tissues and identified metabolic signatures that differentiate BCa from benign disease. A partial least-squares discriminant analysis (PLS-DA) model (leave-one-out cross-validation) was used as a diagnostic model to distinguish benign and BCa tissues. Receiver operating characteristic curve generated either from PC1 loadings of PCA or from predicted Y-values resulted in an area under curve of 0.97. Relative quantification of more than 15 tissue metabolites derived from HR-MAS NMR showed significant differences (P < 0.001) between benign and BCa samples. Noticeably, striking metabolic signatures were observed even for early stage BCa tissues (Ta-T1), demonstrating the sensitivity in detecting BCa. With the goal of cross-validating metabolic signatures derived from HR-MAS NMR, we utilized the same tissue samples to analyze 8 metabolites through gas chromatography-mass spectrometry (GC-MS)-targeted analysis, which undoubtedly complements HR-MAS NMR-derived metabolomic information. Cross-validation through GC-MS clearly demonstrates the utility of a straightforward, nondestructive, and rapid HR-MAS NMR technique for clinical diagnosis of BCa with even greater sensitivity. In addition to its utility as a diagnostic tool, these studies will lead to a better understanding of aberrant metabolic pathways in cancer as well as the design and implementation of personalized cancer therapy through metabolic modulation.
Figures


References
-
- Siegel R, Naishadham D, Jemal A. Cancer statistics, 2012. CA Cancer J Clin. 2012;62(1):10–29. - PubMed
-
- Avritscher EB, Cooksley CD, Grossman HB, Sabichi AL, Hamblin L, Dinney CP, Elting LS. Clinical model of lifetime cost of treating bladder cancer and associated complications. Urology. 2006;68(3):549–53. - PubMed
-
- Frantzi M, Makridakis M, Vlahou A. Biomarkers for bladder cancer aggressiveness. Curr Opin Urol. 2012;22(5):390–6. - PubMed
-
- Tomita M, Kami K. Cancer. Systems biology, metabolomics, and cancer metabolism. Science. 2012;336(6084):990–1. - PubMed
-
- Sreekumar A, Poisson LM, Rajendiran TM, Khan AP, Cao Q, Yu J, Laxman B, Mehra R, Lonigro RJ, Li Y, Nyati MK, Ahsan A, Kalyana-Sundaram S, Han B, Cao X, Byun J, Omenn GS, Ghosh D, Pennathur S, Alexander DC, Berger A, Shuster JR, Wei JT, Varambally S, Beecher C, Chinnaiyan AM. Metabolomic profiles delineate potential role for sarcosine in prostate cancer progression. Nature. 2009;457(7231):910–4. - PMC - PubMed
Publication types
MeSH terms
Grants and funding
LinkOut - more resources
Full Text Sources
Other Literature Sources
Medical
Research Materials
Miscellaneous
