. 2013 Oct;174(1):53-9.
doi: 10.1111/cei.12149.

Transitional B cell subsets in human bone marrow

Affiliations

Transitional B cell subsets in human bone marrow

S Agrawal et al. Clin Exp Immunol. 2013 Oct.

Abstract

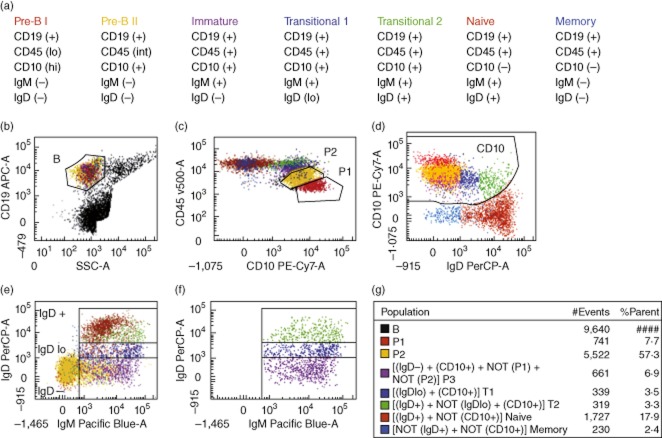
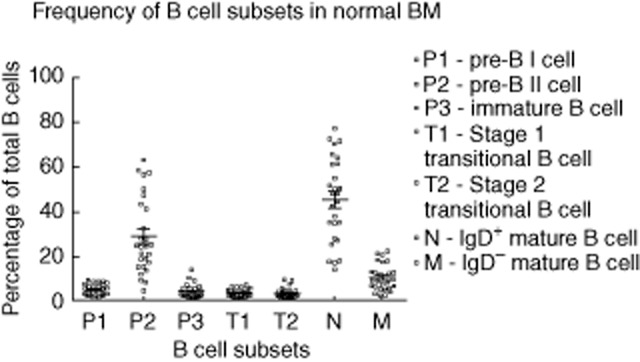
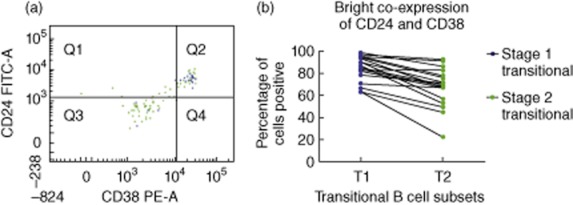
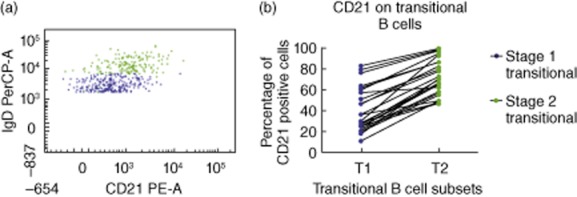
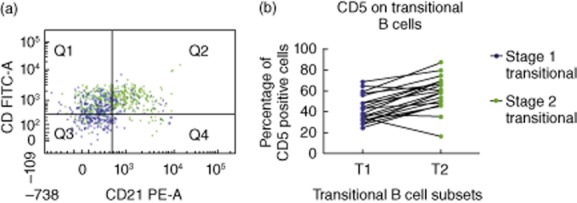
B cells originate from precursors in the bone marrow, and the first cells which migrate to the peripheral blood have been classified as 'transitional B cells'. Transitional B cells have been characterized in human blood with stage 1 (T1) and stage 2 (T2) subsets being proposed. In the present study, 27 normal human bone marrow samples were analysed for transitional B cell markers by eight-colour flow cytometry. T1 transitional B cells (CD45(+)CD19(+)CD10(+)IgM(+)IgD(lo)) and T2 transitional B cells (CD45(+)CD19(+)CD10(+)IgM(+)IgD(+)) were identified in normal bone marrow samples at a mean frequency of 3·2 and 3·1% of total B lineage cells, respectively. A majority of the bone marrow transitional B cells were CD24(hi)CD38(hi) , the phenotype of blood transitional B cells. Consistent with recent peripheral blood data, T2 B cells had a significantly higher CD21 expression compared with T1 B cells (72·4 versus 40·9%) in the bone marrow. These data raise the possibility that transitional B cells are capable of differentiating from T1 to T2 B cells within the bone marrow. Furthermore, transitional cells at either stages 1 or 2 might be capable of migrating out of the bone marrow.

Keywords: CD21; bone marrow; flow cytometry; human; transitional B cells.


Figures

Fig. 1
Fig. 1
Identification of transitional B cell subsets in normal human bone marrow (BM). The dot-plots presented display the flow cytometric approach used to identify various B cell subsets in a representative sample. Each B cell subset was assigned a particular colour. (a) Phenotypic criteria for the characterization of B lineage subsets (b) CD19+ cells with low side-scatter (SSC) were gated as B cells. (b) All BM cells except those with high SSC. In (c–f), only B cells (gated in b) are shown. (c) Pre-B I cells (P1, red) were identified as CD45loCD10hi, and pre-B II cells (P2, yellow) were identified as CD45intCD10+. (d) CD10+ B cells were gated as shown. The CD19 T and natural killer (NK) cells (not shown) were used as a negative control to appropriately draw the CD10+ gate. (e) Identification of B cell subsets. The most immature B cells [CD19+CD10+ immunoglobulin (Ig)DIgM] were used as a negative control to define the IgD+ and IgM+ cell populations. Gates were placed to identify the IgD, IgDlo and IgD+ cell populations; B cells with IgD intensities higher than pre-B cells (CD45lo) and lower than mature B cells (CD10) were classified as low IgD intensity. (f) This is a duplicate of (e); however, only the CD10+IgM+ cells are shown. (g) The gating algorithms employed to derive B cell subsets are shown. Pre-B I cells (P1, red) were identified as CD45loCD10hi and pre-B II cells (P2, yellow) were identified as CD45intCD10+. All other subsets were CD45bright. Immature (P3, purple) B cells were CD10+ and IgD; T1 (dark blue) B cells were IgDlo and CD10+; T2 (light green) B cells were IgD+ and CD10+. Mature CD10 B cells were divided into IgD+ cells (maroon; naive and natural effector B cells), and IgD cells (light blue; IgM only, and switched memory B cells).
Fig. 2
Fig. 2
Enumeration of B cell subsets in normal bone marrow (BM). The mean [± standard error of the mean (s.e.m.)] frequencies of various B cell subsets in the normal BM are presented in this chart (n = 27). The means (± s.e.m.) of each subset are as follows: pre-B I (4·7 ± 0·5%), pre-B II (28·7 ± 3·3%), immature (4 ± 0·6%), T1 (3·2 ± 0·3%), T2 (3·1 ± 0·4%), IgD+ mature B cells (naive and natural effector) (45·2 ± 3·6%) and IgD mature B cells (IgM only, and switched memory) (10·2 ± 1·1%).
Fig. 3
Fig. 3
Bright CD24 and CD38 co-expression on bone marrow (BM) transitional B cell subsets. (a) A representative normal BM sample is presented here, and only transitional B cell subsets are displayed [T1 (blue; CD10+IgM+IgDlo) and T2 (green; CD10+IgM+IgD+)]. (b) This chart displays the proportion of CD24hiCD38hi cells in the T1 and T2 B cell populations. The mean (± s.e.m.) frequency of T1 and T2 B cells that were CD24hiCD38hi in the normal BM was 85·2% (± 2·7) and 69% (± 4·1), respectively (n = 19). The lines join the two values in the same sample. CD24 and CD38 expression is significantly lower in the T2 B cells (P < 0·001).
Fig. 4
Fig. 4
CD21 expression on bone marrow (BM) transitional B cell subsets. (a) A representative normal BM sample is presented here, and only transitional B cell subsets are displayed [T1 (blue; CD10+IgM+IgDlo) and T2 (green; CD10+IgM+IgD+)]. (b) This chart displays the proportion of CD21+ cells in the T1 and T2 B cell populations. The means [± standard error of the mean (s.e.m.)] of CD21+ T1 and CD21+ T2 B cells in the normal BM were 40·9% (± 4·2) and 72·4% (± 3·4), respectively (n = 25). A higher percentage of T2 B cells express CD21 compared with T1 B cells (P < 0·0001).
Fig. 5
Fig. 5
CD5 expression on bone marrow (BM) transitional B cell subsets. (a) A representative normal BM sample is presented here, and only transitional B cell subsets are displayed [T1 (blue; CD10+IgM+IgDlo) and T2 (green; CD10+IgM+IgD+)]. (b) This chart illustrates CD5 expression on T1 and T2 B cells. The mean [± standard error of the mean (s.e.m.)] of CD5+ T1 and CD5+ T2 B cells in the normal BM was 43·1% (± 2·8) and 58·2% (± 3·6), respectively (n = 20). CD5 expression is significantly higher on T2 cells than T1 cells (P < 0·001).

References

    1. Hoebeke I, De Smedt M, Stolz F, et al. T-, B- and NK-lymphoid, but not myeloid cells arise from human CD34(+)CD38(–)CD7(+) common lymphoid progenitors expressing lymphoid-specific genes. Leukemia. 2007;21:311–319. - PubMed
    1. Hardy RR, Hayakawa K. B cell development pathways. Annu Rev Immunol. 2001;19:595–621. - PubMed
    1. Carsetti R, Kohler G, Lamers MC. Transitional B cells are the target of negative selection in the B cell compartment. J Exp Med. 1995;181:2129–2140. - PMC - PubMed
    1. Allman D, Lindsley RC, DeMuth W, Rudd K, Shinton SA, Hardy RR. Resolution of three nonproliferative immature splenic B cell subsets reveals multiple selection points during peripheral B cell maturation. J Immunol. 2001;167:6834–6840. - PubMed
    1. Sims GP, Ettinger R, Shirota Y, Yarboro CH, Illei GG, Lipsky PE. Identification and characterization of circulating human transitional B cells. Blood. 2005;105:4390–4398. - PMC - PubMed

Publication types