
The genome sequence of the most widely cultivated cacao type and its use to identify candidate genes regulating pod color

Juan C Motamayor et al. Genome Biol. .

Abstract

Background: Theobroma cacao L. cultivar Matina 1-6 belongs to the most cultivated cacao type. The availability of its genome sequence and methods for identifying genes responsible for important cacao traits will aid cacao researchers and breeders.

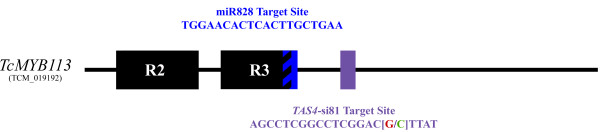
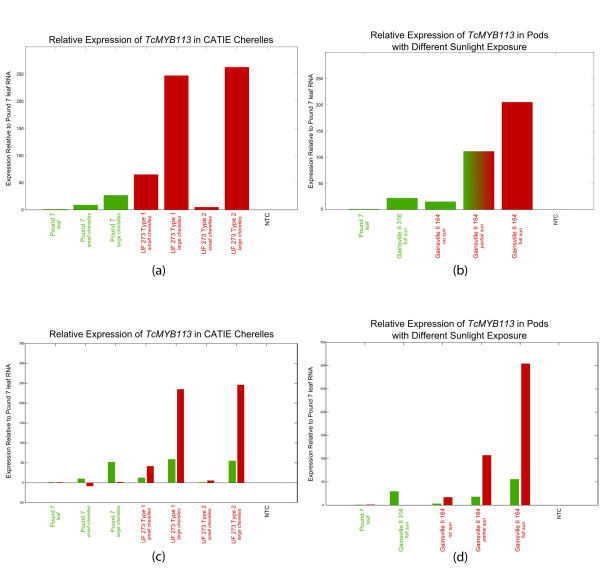
Results: We describe the sequencing and assembly of the genome of Theobroma cacao L. cultivar Matina 1-6. The genome of the Matina 1-6 cultivar is 445 Mbp, which is significantly larger than a sequenced Criollo cultivar, and more typical of other cultivars. The chromosome-scale assembly, version 1.1, contains 711 scaffolds covering 346.0 Mbp, with a contig N50 of 84.4 kbp, a scaffold N50 of 34.4 Mbp, and an evidence-based gene set of 29,408 loci. Version 1.1 has 10x the scaffold N50 and 4x the contig N50 as Criollo, and includes 111 Mb more anchored sequence. The version 1.1 assembly has 4.4% gap sequence, while Criollo has 10.9%. Through a combination of haplotype, association mapping and gene expression analyses, we leverage this robust reference genome to identify a promising candidate gene responsible for pod color variation. We demonstrate that green/red pod color in cacao is likely regulated by the R2R3 MYB transcription factor TcMYB113, homologs of which determine pigmentation in Rosaceae, Solanaceae, and Brassicaceae. One SNP within the target site for a highly conserved trans-acting siRNA in dicots, found within TcMYB113, seems to affect transcript levels of this gene and therefore pod color variation.

Conclusions: We report a high-quality sequence and annotation of Theobroma cacao L. and demonstrate its utility in identifying candidate genes regulating traits.


Figures

Figure 1
Figure 1
Fluorescence in situ hybridization (FISH)-based karyotype of Theobroma cacao Matina 1-6. A FISH cocktail comprised of two Cent-Tc oligonucleotide probes plus four BAC clones permitted identification of the ten chromosome pairs. (A) Ideogram of the T. cacao Matina 1-6 karyotype. Centromeres are coded in accordance with the color and size of the combined FISH signals for OLI-07 (green pseudo-colored) and OLI-13 (red pseudo-colored). Bacterial artificial chromosome (BAC) probes (red or green) are indicated by paired dots near chromosome termini. The following BACs were used for probes: for Tc03, TcC_Ba057I03 and TcC_Ba027M06; for Tc04, TcC_BB065A03; for Tc06, TcC_Ba018I22. Relative chromosome sizes are not indicated, with the exception of the satellite arm of Tc07, which is shown as a knob. (B) Chromosomes labeled with the FISH cocktail arranged by chromosome number. Chromosomes are discriminated as follows: Tc01 has the second-brightest yellow centromere. Tc02 has the brightest yellow centromere. Tc03, Tc04, Tc06, and Tc07 all have similar centromere labeling (pure green), but are differentiated based on unique BAC probe labeling: Tc03 is labeled at each end by green BAC probes; Tc04 is labeled at one end by a green BAC probe; Tc06 is labeled at one end by a red BAC probe; and Tc09 is not labeled by BAC probes. Tc05 has the second-brightest red centromere; Tc08 has the brightest red centromere with an 'internal' green domain; and Tc09 has the brightest yellow-green centromere and is much longer than Tc10, which has the second-brightest yellow-green centromere. (C) DAPI channel image of chromosomes in (B). The satellite arms of Tc07 are above the centromeres. (D) A FISH image containing a complete chromosome spread. (E) Corresponding DAPI channel image from which chromosomes in (C) were extracted.
Figure 2
Figure 2
Genomic features of Theobroma cacao Matina 1-6. Shown are overall densities of evidence sets (see Materials and methods) that contributed to T. cacao Matina 1-6 annotation, and the final results as described in the text. Data were plotted for the chromosomes (pseudomolecules) in 50 Kbp sliding windows. Yellow denotes protein homology evidence by alignment to proteins of eight previously annotated plant genomes; blue denotes mapping of transcriptome data from second-generation RNA sequencing; green denotes gene models; red denotes transposons from homology-based and structure-based annotation, as described in the text (see Materials and methods).
Figure 3
Figure 3
Statistical significance of association of pod color with markers on chromosome 4 of the parental Theobroma cacao haplotypes. The y-value at each marker is -log10(P-value) with the P-value computed using Fisher's exact test for both haplotypes of each parent, taking as input a 2 × 2 contingency table per marker. The segment between the vertical dashed lines is the genomic region most strongly associated with pod color in all three mapping populations. Thresholds denoted by the dashed red line in each plot were calculated using the Bonferroni correction for multiple comparisons at α = 0.05.
Figure 4
Figure 4
Haplotype analysis of trees exhibiting recombination in the chromosome 4 segment associated with pod color. (a) Recombinant trees from population T4 Type 1; (b) recombinant trees from population T4 Type 2; (c) recombinant trees from population MP01. Maternal and paternal haplotypes are shown at the top of each figure. Tree names are colored according to pod-color phenotype. Red represents haplotypes associated with red pod color, and green represents haplotypes associated with green pod color from the two parents, while the yellow marker values represent uncertainty in the haplotype assignment. The black vertical bars surround the most likely region regulating pod-color variation according to the haplotypes of the recombinants (that is, if a recombinant shows only haplotypes for a given marker associated with green pods, but its phenotype is red, this indicates that the marker is not associated with pod color; this is the case for CATIE 1-63 at marker 22,053,861 in (a). The P-values from the Fisher's exact test are shown above each marker for each parent. The P-values are colored by parental phenotype, with the father always being bright red. The location of three candidate genes is indicated by colored dots above the closest markers.
Figure 5
Figure 5
mir828 and TAS4-siR81 (-) sequence targets in TcMYB113. The green base pair indicates the single-nucleotide polymorphism (SNP) (20,878,891) that was most significantly associated with pod-color variation (C is associated with green pods and G is associated with red pods).
Figure 6
Figure 6
TcMYB113 transcript levels determined by quantitative PCR analysis of RNA from the pericarp of cherelles (young Theobroma cacao fruits) of genotypes with green or red pod color (genotype names are colored accordingly). Bar colors indicate the color of (a,b) the cherelles and (c,d) the alleles analyzed Although standard deviations were calculated, the values obtained were too low to graph at the scale used below. All RNA levels are normalized to control RNA from Pound 7 leaf tissue. (a) TcMYB113 transcript levels in the pericarp of small (10 to 20 mm length) and large (30 to 50 mm length) cherelles of the green-pod genotype Pound 7 and the pericarp of the red-pod genotypes UF 273 Type 1 and Type 2. (b) TcMYB113 transcript levels in the pericarp of green cherelles of the green-pod genotype Gainesville II 316 and the pericarp of green, green plus red. and red cherelles of the red-pod genotype Gainesville II 164. Green cherelles from Gainsville II 164 were obtained from the completely shaded part of the tree sampled. (c) Allele-specific TcMYB113 transcript levels in the pericarp from small (10 to 20 mm length) and large (30 to 50 mm length) cherelles of the green-pod genotype Pound 7 and the pericarp of the red-pod genotypes UF 273 Type 1 and Type 2. (d) TcMYB113 allele-specific transcript levels in the pericarp of green cherelles of the green-pod genotype Gainesville II 316 and inthe pericarp of green (no sun), green plus red (partial sun), and red (full sun) cherelles of the red-pod genotype Gainesville II 164. Green cherelles from Gainsville II 164 were obtained from a completely shaded area of the tree sampled. Red bars in the green-pod Pound 7 is due to background fluorescence.

References

    1. Motamayor JC, Risterucci AM, Lopez PA, Ortiz CF, Moreno A, Lanaud C. Cacao domestication I: the origin of the cacao cultivated by the Mayas. Heredity. 2002;14:380–386. doi: 10.1038/sj.hdy.6800156. - DOI - PubMed
    1. Motamayor JC, Lachenaud P, da Silva e Mota JW, Loor R, Kuhn DN, Brown JS, Schnell RJ. Geographic and genetic population differentiation of the Amazonian chocolate tree (Theobroma cacao L). PLoS ONE. 2008;14:e3311. doi: 10.1371/journal.pone.0003311. - DOI - PMC - PubMed
    1. Figueira A AL. In: Biotechnology of fruit and nut crops. Litz RE, editor. CAB International Biosciences: Wallingford, UK; 2005. Theobroma cacao (Cacao). pp. 639–670.
    1. Foundation TWC. The World Cocoa Foundation. http://www.worldcocoafoundation.org/learn-about-cocoa/
    1. Guiltinan MJ VJ, Zhang D, Figueira A. In: Genomics of Tropical Crop Plants. Moore PH & Ming R, editor. Springer New York; 2008. Genomics of Theobroma cacao, "The Food of the Gods". pp. 146–170.

Publication types

Substances

Associated data

LinkOut - more resources