Postnatal epigenetic reprogramming in the germline of a marsupial, the tammar wallaby
- PMID: 23732002
- PMCID: PMC3687581
- DOI: 10.1186/1756-8935-6-14
Postnatal epigenetic reprogramming in the germline of a marsupial, the tammar wallaby
Abstract
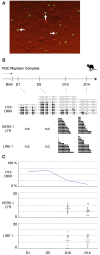
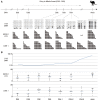
Background: Epigenetic reprogramming is essential to restore totipotency and to reset genomic imprints during mammalian germ cell development and gamete formation. The dynamic DNA methylation change at DMRs (differentially methylated regions) within imprinted domains and of retrotransposons is characteristic of this process. Both marsupials and eutherian mammals have genomic imprinting but these two subgroups have been evolving separately for up to 160 million years. Marsupials have a unique reproductive strategy and deliver tiny, altricial young that complete their development within their mother's pouch. Germ cell proliferation in the genital ridge continues after birth in the tammar wallaby (Macropus eugenii), and it is only after 25 days postpartum that female germ cells begin to enter meiosis and male germ cells begin to enter mitotic arrest. At least two marsupial imprinted loci (PEG10 and H19) also have DMRs. To investigate the evolution of epigenetic reprogramming in the marsupial germline, here we collected germ cells from male pouch young of the tammar wallaby and analysed the methylation status of PEG10 and H19 DMR, an LTR (long terminal repeat) and a non-LTR retrotransposons.
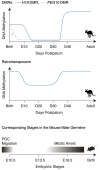
Results: Demethylation of the H19 DMR was almost completed by 14 days postpartum and de-novo methylation started from 34 days postpartum. These stages correspond to 14 days after the completion of primordial germ cell migration into genital ridge (demethylation) and 9 days after the first detection of mitotic arrest (re-methylation) in the male germ cells. Interestingly, the PEG10 DMR was already unmethylated at 7 days postpartum, suggesting that the timing of epigenetic reprogramming is not the same at all genomic loci. Retrotransposon methylation was not completely removed after the demethylation event in the germ cells, similar to the situation in the mouse.
Conclusions: Thus, despite the postnatal occurrence of epigenetic reprogramming and the persistence of genome-wide undermethylation for 20 days in the postnatal tammar, the relative timing and mechanism of germ cell reprogramming are conserved between marsupials and eutherians. We suggest that the basic mechanism of epigenetic reprogramming had already been established before the marsupial-eutherian split and has been faithfully maintained for at least 160 million years and may reflect the timing of the onset of mitotic arrest in the male germline.
Figures


Similar articles
-
DNA methylation dynamics in the germline of the marsupial tammar wallaby, Macropus eugenii.DNA Res. 2019 Feb 1;26(1):85-94. doi: 10.1093/dnares/dsy040. DNA Res. 2019. PMID: 30535324 Free PMC article.
-
Male germline development in the tammar wallaby, Macropus eugenii.Reproduction. 2021 Mar;161(3):333-341. doi: 10.1530/REP-20-0634. Reproduction. 2021. PMID: 33486468
-
Retrotransposon silencing by DNA methylation can drive mammalian genomic imprinting.PLoS Genet. 2007 Apr 13;3(4):e55. doi: 10.1371/journal.pgen.0030055. PLoS Genet. 2007. PMID: 17432937 Free PMC article.
-
Genomic imprinting in marsupial placentation.Reproduction. 2008 Nov;136(5):523-31. doi: 10.1530/REP-08-0264. Epub 2008 Sep 19. Reproduction. 2008. PMID: 18805821 Review.
-
The origin and evolution of genomic imprinting and viviparity in mammals.Philos Trans R Soc Lond B Biol Sci. 2013 Jan 5;368(1609):20120151. doi: 10.1098/rstb.2012.0151. Philos Trans R Soc Lond B Biol Sci. 2013. PMID: 23166401 Free PMC article. Review.
Cited by
-
Post-natal imprinting: evidence from marsupials.Heredity (Edinb). 2014 Aug;113(2):145-55. doi: 10.1038/hdy.2014.10. Epub 2014 Mar 5. Heredity (Edinb). 2014. PMID: 24595366 Free PMC article. Review.
-
Get Out and Stay Out: New Insights Into DNA Methylation Reprogramming in Mammals.Front Cell Dev Biol. 2021 Jan 7;8:629068. doi: 10.3389/fcell.2020.629068. eCollection 2020. Front Cell Dev Biol. 2021. PMID: 33490089 Free PMC article. Review.
-
The admixed brushtail possum genome reveals invasion history in New Zealand and novel imprinted genes.Nat Commun. 2023 Oct 17;14(1):6364. doi: 10.1038/s41467-023-41784-8. Nat Commun. 2023. PMID: 37848431 Free PMC article.
-
Hypothesis: gonadal temperature influences sex-specific imprinting.Front Genet. 2014 Aug 25;5:294. doi: 10.3389/fgene.2014.00294. eCollection 2014. Front Genet. 2014. PMID: 25202325 Free PMC article.
-
Identification of a novel antisense noncoding RNA, ALID, transcribed from the putative imprinting control region of marsupial IGF2R.Epigenetics Chromatin. 2018 Sep 29;11(1):55. doi: 10.1186/s13072-018-0227-8. Epigenetics Chromatin. 2018. PMID: 30268152 Free PMC article.
References
LinkOut - more resources
Full Text Sources
Other Literature Sources

