. 2013 Aug 15;591(16):3887-99.
doi: 10.1113/jphysiol.2013.256628. Epub 2013 Jun 3.

Restricted diffusion of calretinin in cerebellar granule cell dendrites implies Ca²⁺-dependent interactions via its EF-hand 5 domain

Affiliations

Restricted diffusion of calretinin in cerebellar granule cell dendrites implies Ca²⁺-dependent interactions via its EF-hand 5 domain

Oliver Arendt et al. J Physiol. .

Abstract

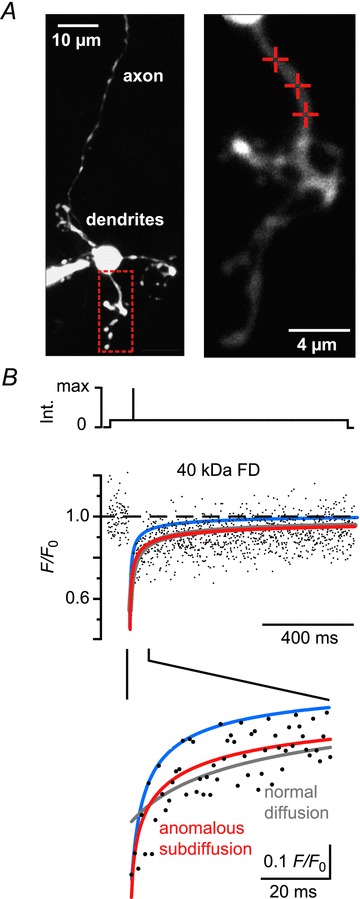
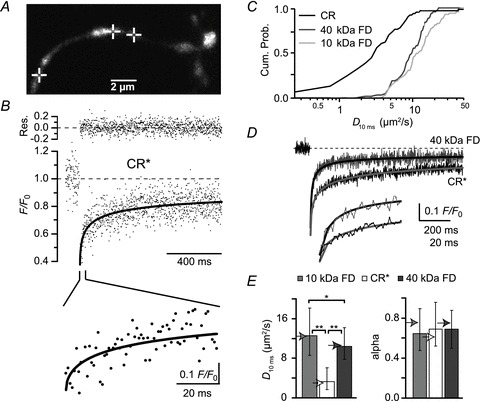
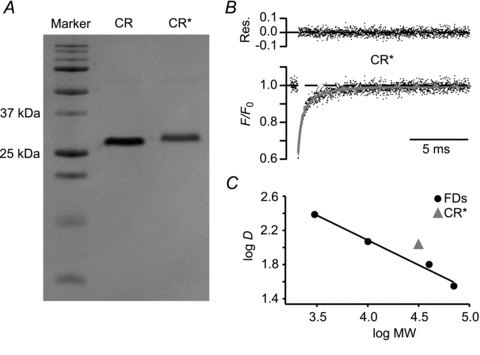
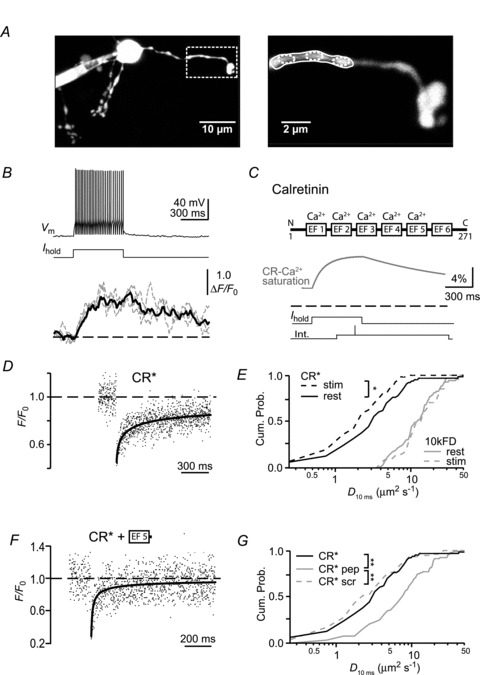
Ca²⁺-binding proteins (CaBPs) are important regulators of neuronal Ca²⁺ signalling, acting either as buffers that shape Ca²⁺ transients and Ca²⁺ diffusion and/or as Ca²⁺ sensors. The diffusional mobility represents a crucial functional parameter of CaBPs, describing their range-of-action and possible interactions with binding partners. Calretinin (CR) is a CaBP widely expressed in the nervous system with strong expression in cerebellar granule cells. It is involved in regulating excitability and synaptic transmission of granule cells, and its absence leads to impaired motor control. We quantified the diffusional mobility of dye-labelled CR in mouse granule cells using two-photon fluorescence recovery after photobleaching. We found that movement of macromolecules in granule cell dendrites was not well described by free Brownian diffusion and that CR diffused unexpectedly slow compared to fluorescein dextrans of comparable size. During bursts of action potentials, which were associated with dendritic Ca²⁺ transients, the mobility of CR was further reduced. Diffusion was significantly accelerated by a peptide embracing EF-hand 5 of CR. Our results suggest long-lasting, Ca²⁺-dependent interactions of CR with large and/or immobile binding partners. These interactions render CR a poorly mobile Ca²⁺ buffer and point towards a Ca²⁺ sensor function of CR.


Figures

Figure 1
Figure 1. Anomalous subdiffusion in granule cell dendrites
A, left: contrast-enhanced two-photon image (z-stack) of a granule cell filled with a 40 kDa FD (500 μm) via a somatic patch pipette. The red box outlines the dendritic region shown magnified on the right. Cross-hairs denote the positions on which fluorescence recovery after photobleaching recordings (shown in B) were performed. B, top: scheme of the laser intensity protocol. Middle: dendritic fluorescence recovery after photobleaching time course. The dots represent the average of three normalized recordings (F/F0) from the spots denoted in A. The lines represent fits to the fluorescence recovery assuming free diffusion (grey line, eqn 1 in Methods) or anomalous subdiffusion (red line, eqn 2). The blue line shows the calculated recovery for free diffusion using the previously published diffusion coefficient of 40 kDa FD (Schmidt et al. 2007a). The lower panel shows the initial recovery expanded in time. Note that the subdiffusion model yields the best fit to the recovery. FD, fluorescein dextrans; Int., laser intensity.
Figure 2
Figure 2. Reduced mobility of CR in granule cells
A, granule cell dendrite loaded with 80 μm of CR* via a somatic patch pipette. The cross-hairs mark the spots at which FRAP experiments were performed. B, average of three FRAP recordings from the points indicated in A. The black line represents a fit by the subdiffusion equation. In the top line, the residuals (measured values – fit values) are shown. The lower panel shows the initial recovery expanded in time. C, cumulative probability histograms of time-dependent D values at 10 ms (D10ms). D, grand averages of FRAP recordings from different cells but with similar bleach depth (45–55%) obtained with 40 kDa FD (grey, n= 31 from 10 cells) and CR* (black, n= 25 from six cells), fitted with the anomalous subdiffusion equation (continuous lines). The lower panel shows the initial recoveries expanded in time. E, values of D10ms and anomalous subdiffusion coefficients (alpha) for 10 and 40 kDa FD and CR*, as indicated (n= 69 FRAP measurements from 24 cells for 10 kDa FD, n= 69 from 23 cells for 40 kDa FD, and n= 63 from 18 cells for CR*). The arrowheads indicate the values obtained by fitting the grand averages for 40 kDa FD and CR* (as in D) and for 10 kDa FD (n= 39 from 10 cells). Note that the molecular weight of CR* is ∼31.5 kDa. *P < 0.05, **P < 0.001. CR, calretinin; CR*, dye-labelled CR; FD, fluorescein dextrans; FRAP, fluorescence recovery after photobleaching.
Figure 3
Figure 3. CR* diffusion in vitro
A, SDS-gel of native and CR* (CR and CR*, respectively). MW markers are shown in the left lane: 10, 15, 20, 25, 37, 50, 75, 100, 150 and 250 kDa from bottom to top. B, aqueous fluorescence recovery after photobleaching time course of CR* dissolved in pipette solution in a cuvette (average of 2500 individual recordings) and a fit to a three-dimensional, normal diffusion equation (grey line; top: residuals). C, logarithms of the mean aqueous D values of CR*, 3 kDa, 10 kDa, 40 kDa and 70 kDa FD plotted against the logarithms of their MW. Four experiments each. s.e.m. values are smaller than the markers. Linear regression to the dextran data yielded a slope of –0.55. CR, calretinin; CR*, dye-labelled CR; FD, fluorescein dextrans; MW, molecular weight; Res., residuals.
Figure 4
Figure 4. Decreased mobility of CR* during neuronal activity
A, left: a granule cell loaded with 50 μm OGB-1 and 50 μm Atto-637 via a somatic patch pipette. The box delineates the dendritic region (shown magnified on the right) from which the fluorescence signals in B were recorded. The corresponding regions of interest are denoted by solid and dashed ellipses. B, top: voltage response (Vm) to a somatic current injection (Ihold) of the granule cell shown in A. Bottom: associated relative fluorescence increases of OGB-1 (ΔF/F0) recorded from the dendritic regions indicated by the small dashed (grey traces) and large solid ellipses (black trace) in A. C, scheme of CR (upper panel) with the EF-hands of which five bind Ca2+ (Schwaller et al. 1997). The N- and C-terminals as well as the numbering of the amino acids are indicated. The lower panel shows a numerical simulation of CR's Ca2+ saturation during the average action potential train in the absence of indicator dye. The dashed line indicates 0% saturation. The resting saturation is 4.7%. The two bottom traces illustrate the experimental approach for FRAP recordings during action potential firing. D, FRAP time course of CR* during repetitive firing (average of six recordings). The continuous line represents a fit of the recovery to the subdiffusion equation. E, cumulative probability graph of D10ms values under control conditions (‘CR* rest’, ‘10 kDa FD rest’; data from Fig. 2C) and during action potential firing (‘CR* stim’; n= 56 recordings from 10 cells; *P < 0.05 and ‘10 kDa FD* stim’; n= 36 recordings from nine cells). F, FRAP time course of CR* in the presence of peptide resembling EF-hand 5 of CR, the putative interaction site. The continuous line represents a fit of the recovery to the subdiffusion equation. Note the accelerated recovery compared to Fig. 2B. G, cumulative probability histograms of D10ms values under control conditions (CR*; as in 2C) or in the presence of peptide representing EF-hand 5 of CR (‘pep’; n= 92 recordings from 17 cells) or a scrambled peptide (‘scr’; n= 76/7). **P < 0.001. CR, calretinin; CR*, dye-labelled CR; FD, fluorescein dextrans.

References

    1. Allbritton NL, Meyer T, Stryer L. Range of messenger action of calcium ion and inositol 1,4,5-trisphosphate. Science. 1992;258:1812–1815. - PubMed
    1. Arai R, Winsky L, Arai M, Jacobowitz DM. Immunohistochemical localization of calretinin in the rat hindbrain. J Comp Neurol. 1991;310:21–44. - PubMed
    1. Arrio-Dupont M, Cribier S, Foucault G, Devaux PF, d’Albis A. Diffusion of fluorescently labeled macromolecules in cultured muscle cells. Biophys J. 1996;70:2327–2332. - PMC - PubMed
    1. Axelrod D, Koppel DE, Schlessinger J, Elson E, Webb WW. Mobility measurement by analysis of fluorescence photobleaching recovery kinetics. Biophys J. 1976;16:1055–1069. - PMC - PubMed
    1. Bitto E, Bingman CA, Bittova L, Frederick RO, Fox BG, Phillips GN. X-ray structure of Danio rerio secretagogin: A hexa-EF-hand calcium sensor. Proteins. 2009;76:477–483. - PMC - PubMed

Publication types

LinkOut - more resources