. 2013 Aug;33(15):3036-49.
doi: 10.1128/MCB.01717-12. Epub 2013 Jun 3.

Single quantum dot tracking reveals that an individual multivalent HIV-1 Tat protein transduction domain can activate machinery for lateral transport and endocytosis

Affiliations

Single quantum dot tracking reveals that an individual multivalent HIV-1 Tat protein transduction domain can activate machinery for lateral transport and endocytosis

Yasuhiro Suzuki et al. Mol Cell Biol. 2013 Aug.

Abstract

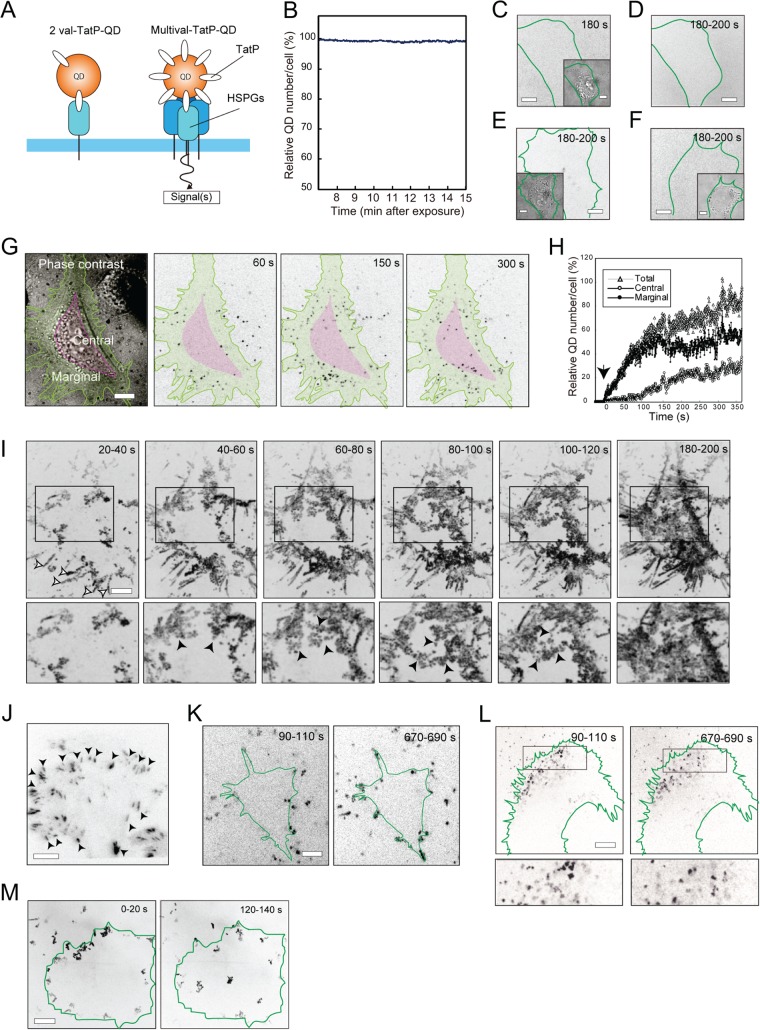
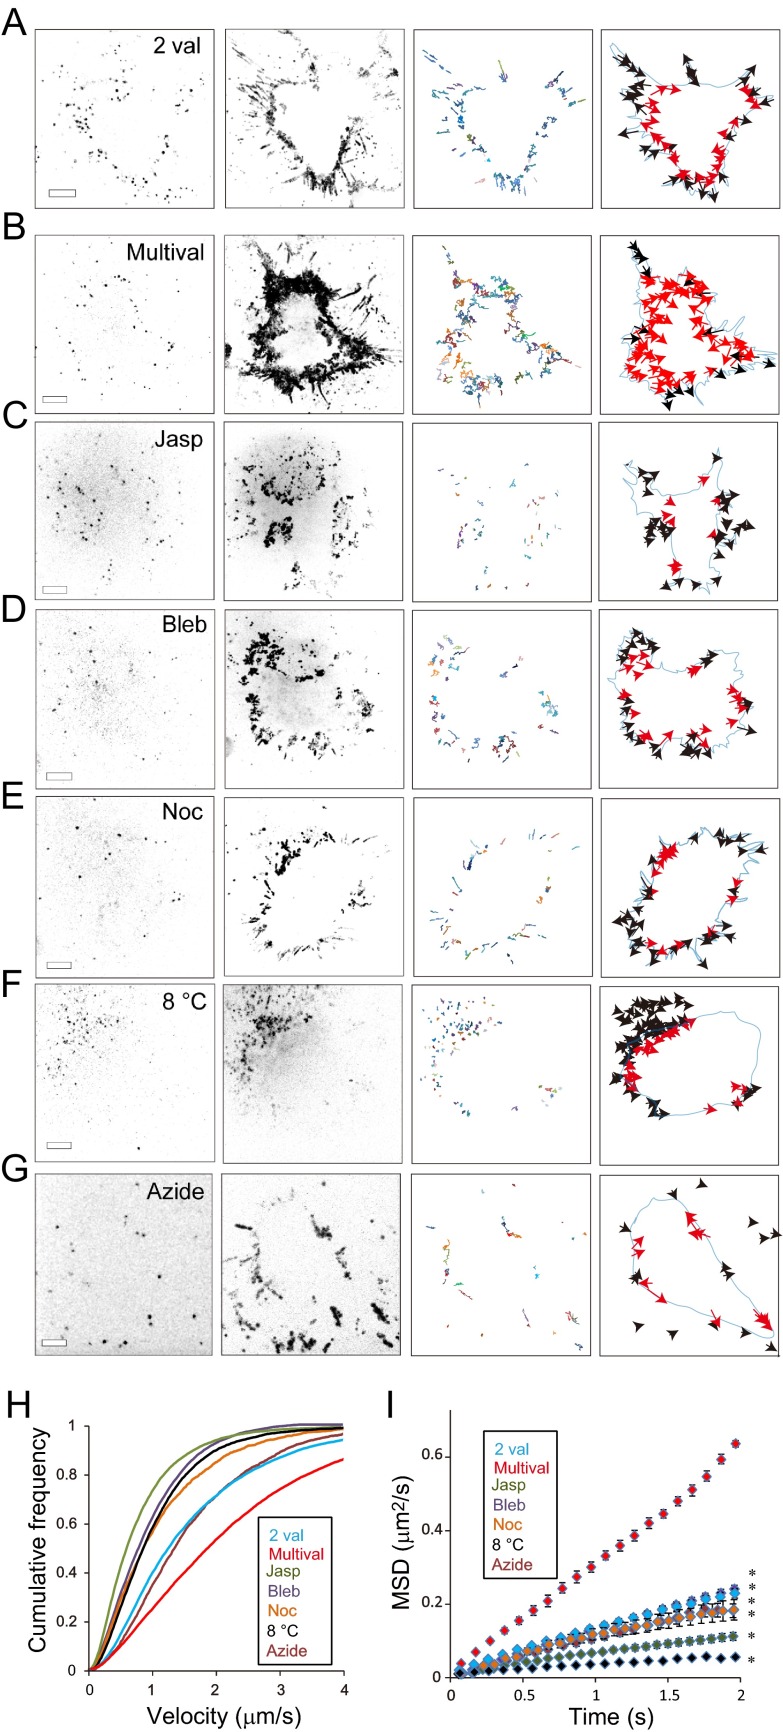
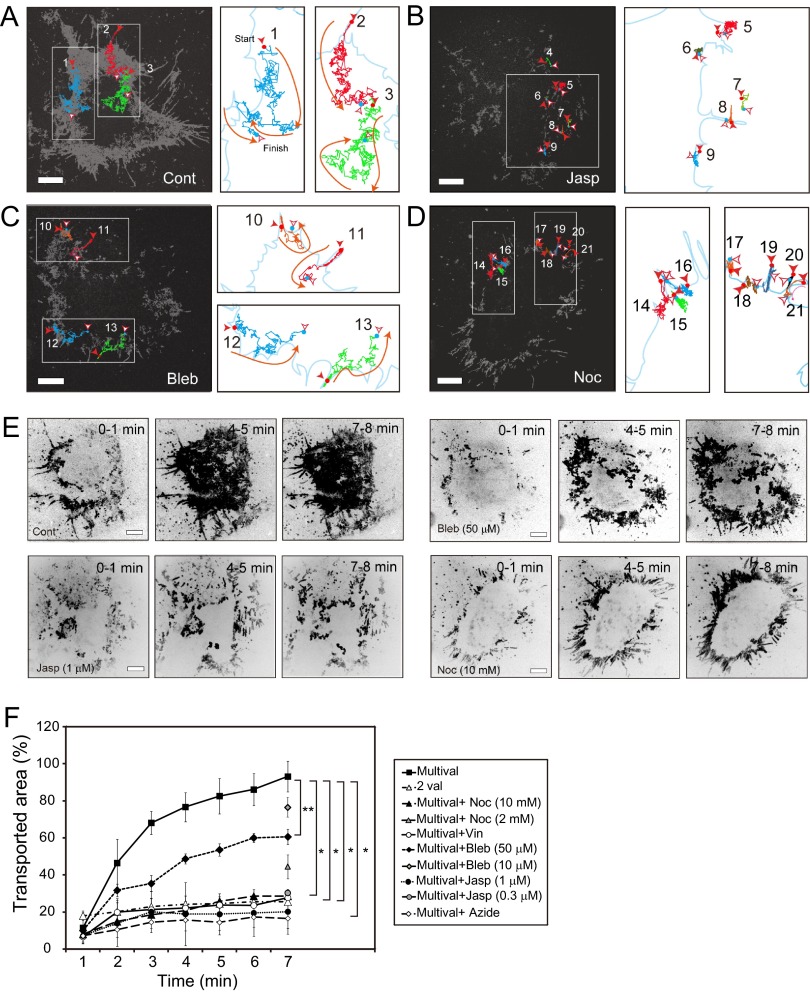
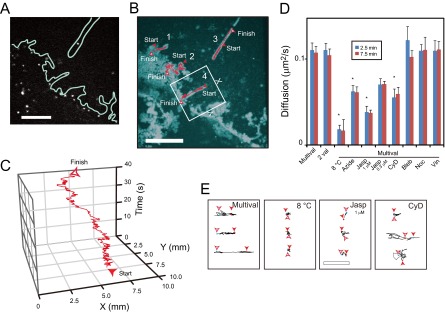
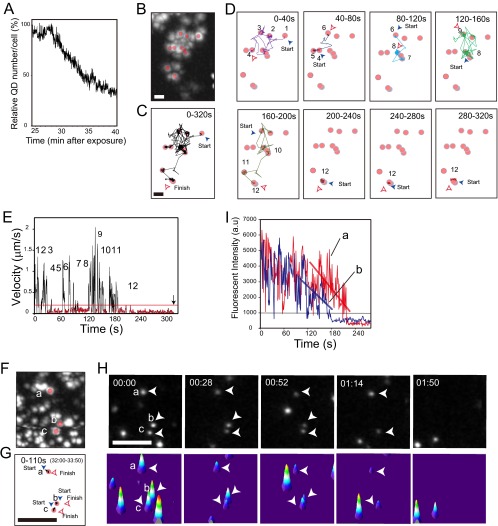
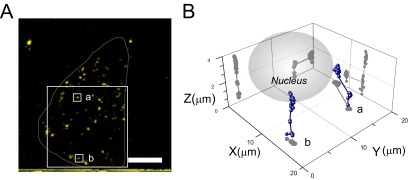
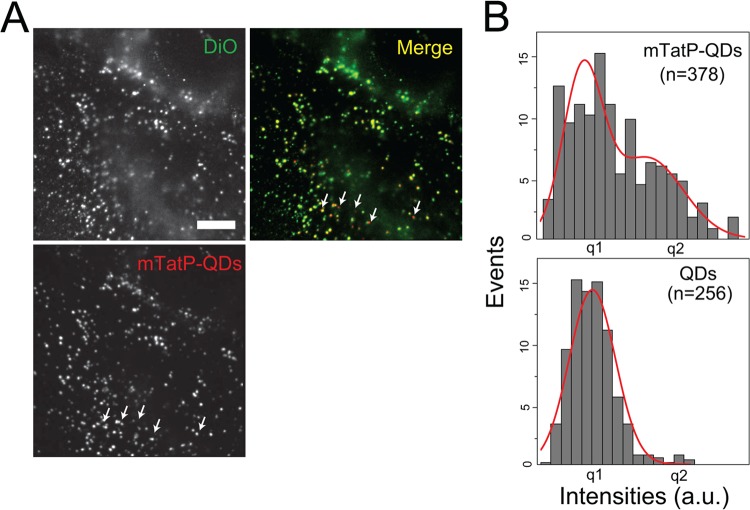
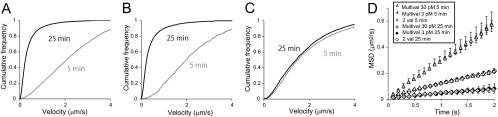
The mechanisms underlying the cellular entry of the HIV-1 Tat protein transduction domain (TatP) and the molecular information necessary to improve the transduction efficiency of TatP remain unclear due to the technical limitations for direct visualization of TatP's behavior in cells. Using confocal microscopy, total internal reflection fluorescence microscopy, and four-dimensional microscopy, we developed a single-molecule tracking assay for TatP labeled with quantum dots (QDs) to examine the kinetics of TatP initially and immediately before, at the beginning of, and immediately after entry into living cells. We report that even when the number of multivalent TatP (mTatP)-QDs bound to a cell was low, each single mTatP-QD first locally induced the cell's lateral transport machinery to move the mTatP-QD toward the center of the cell body upon cross-linking of heparan sulfate proteoglycans. The centripetal and lateral movements were linked to the integrity and flow of actomyosin and microtubules. Individual mTatP underwent lipid raft-mediated temporal confinement, followed by complete immobilization, which ultimately led to endocytotic internalization. However, bivalent TatP did not sufficiently promote either cell surface movement or internalization. Together, these findings provide clues regarding the mechanisms of TatP cell entry and indicate that increasing the valence of TatP on nanoparticles allows them to behave as cargo delivery nanomachines.


Figures

Fig 1
Fig 1
mTatP-QDs on the lamellipodial edge move centripetally via energy-dependent mechanisms. (A) Schematic comparison of bivalent (2 val) and multivalent (multival)-TatP-QDs initiating a downstream signaling cascade after binding to HSPGs. (B) Changes in the number of mTatP-QDs on the basal cell surface over time. Graph made from sequential TIRFM images at 2.5 Hz. (C and D) Selected CM frame (C), a phase-contrast image (C, inset), and maximum intensity projection (50 frames, 20 s) (D) of a HeLa cell exposed to 5 nM St-QDs. (E and F) Representative maximum intensity projections (50 frames, 20 s) for HeLa cells exposed to 30 pM mTatP-QDs and cultured with 10 U heparin (E) or treated with HS-lyase (F). Insets, phase-contrast images. (G) Phase-contrast and selected CM frames of a HeLa cell exposed to 30 pM mTatP-QDs. The marginal (green) and central (pink) areas of the cell are demarcated by color. (H) Typical time course of the numbers of mTatP-QDs bound to the total, marginal, and central areas. The arrow indicates mTatP-QD addition. (I) Representative maximum intensity projections (50 frames, 20 s) of mTatP-QDs. The lower panels are magnified images of the selected areas in the upper panels. Open and closed arrowheads indicate mTatP on the filopodia and mTatP moving centripetally on the basal cell surface, respectively. Panels C to I were from 2.5-Hz movies. (J) Representative TIRF micrograph of a HeLa cell expressing FAT domain-AcGFP. Arrowheads denote FAs. (K to M) Maximum intensity projections (200 frames, 20 s) of mTatP-QDs (30 pM) on HeLa cells cultured with 5 mM sodium azide (K) or at 8°C (L) and subsequently returned to 37°C (M). Panels K to M were from 10-Hz movies. Bars, 5 μm.
Fig 2
Fig 2
Analysis of the mechanisms of the centripetal movement of TatP-QDs on lamellipodial edges. (A to G) Selected CM frames (left panels), representative maximum intensity projections (160 frames, 16 s) (second panels from the left), TatP-QD trajectories (8 s) (second panels from the right), and their vectors (right panels) on HeLa cells exposed to TatP-QDs with the indicated valence under different conditions. The images and trajectories were from 10-Hz movies. CM images of HeLa cells exposed to 300 pM 2-val-TatP-QDs (A) or 30 pM mTatP-QDs in the absence (B) and presence of 1 μM jasplakinolide (Jasp) (C), 50 μM blebbistatin (Bleb) (D), 10 mM nocodazole (Noc) (E), or 5 nM sodium azide (Azide) (G). CM images were also collected from HeLa cells exposed to 30 pM mTatP-QDs and cultured at 8°C (8°C) (F). The black and red arrows in the right panels indicate the QDs initially bound to the filopodia and lamellipodia, respectively. Bars, 5 μm. (H and I) Velocity distributions (H) and MSD curves (I) of TatP-QDs with the indicated valences on HeLa cells treated with the indicated drugs or cultured at 8°C. The mean velocities (±SEM) at 2.5 min after TatP exposure were 2.24 ± 0.01 μm/s (multival; n = 912), 1.66 ± 0.01 μm/s (2 val; n = 1,104, P < 10−3), 0.69 ± 0.01 μm/s (Jasp; n = 678, P < 10−4), 0.72 ± 0.01 μm/s (Bleb; n = 390, P < 10−4), 0.79 ± 0.01 μm/s (Noc; n = 183, P < 10−4), 1.62 ± 0.02 μm/s (Azide; n = 243, P < 10−3), and 1.08 ± 0.01 μm/s (8°C; n = 808, P < 10−4). The data were obtained from 10-Hz movies. *, P < 10−4. Error bars, SEM. The statistical significance was calculated with Dunnett's multiple comparison versus control.
Fig 3
Fig 3
The movement of mTatP-QDs on the lamellipodial edge requires the integrity and flow of actomyosin and microtubules. (A to D) The entire trajectories of mTatP-QDs over 1.5 min on cells exposed to 30 pM mTatP-QDs in the absence (A) or presence of 1 μM jasplakinolide (B), 50 μM blebbistatin (C), or 10 mM nocodazole (D) are indicated by gray lines (left panels). Examples of representative trajectories are denoted with colors. The right panels are magnified images of the selected areas in the left panels. The accompanying arrows indicate the direction of movement. The trajectories were created from 10-Hz CM movies. (E) Representative maximum intensity projections for mTatP-QDs (600 frames, 1 min) recorded at 10 Hz. (F) The percentage of the area over which mTatP-QDs moved during 1 min was normalized to the entire cell surface area. HeLa cells were used in the absence (Cont) and presence of 0.3 or 1 μM jasplakinolide (Jasp), 10 or 50 μM blebbistatin (Bleb), 2 or 10 mM nocodazole (Noc), or 5 μM vinblastine (Vin). The data were from movies using ImageJ software. The values were first calculated for individual cells, and the results from three independent experiments performed under the same treatment conditions were averaged. Error bars, SEM. Bars, 5 μm. *, P < 10−5; **, P < 10−4. The statistical significance was calculated with Dunnett's multiple comparison versus control.
Fig 4
Fig 4
mTatP-QDs on filopodia move via preexisting actin-guided mechanisms. (A to C) Representative trajectories of mTatP-QDs on filopodia in cells exposed to 30 pM mTatP-QDs recorded at 10 Hz. Selected CM frame (A), maximum intensity projection and trajectories (B), and a typical position-over-time trajectory (selected area from panel B) (C). Also see Movie S1 in the supplemental material. (D and E) Effects of the TatP valence, culture temperature, and specific inhibitors on the movement of mTatP-QDs on filopodia. The mean diffusion coefficients (D) at 2.5 and 7.5 min after mTatP-QD exposure and representative trajectories (at 2.5 min after exposure for a 6-s observation, cell body on the right) (E) of 2-val- and multivalent-TatP on filopodia under the indicated conditions. Jasp, 0.3 or 1 μM jasplakinolide; Bleb, 50 μM blebbistatin; Noc, 10 mM nocodazole; Vin, 5 μM vinblastine; CyD, 50 nM cytochalasin D. *, P < 10−4. Error bars, SEM. Bars, 3 μm. The statistical significance was calculated with Dunnett's multiple comparison versus control.
Fig 5
Fig 5
Single-molecule TIRFM imaging demonstrates the kinetics of mTatP-QDs immediately before and during internalization. (A) Changes in the number of mTatP molecules on the basal cell surface of HeLa cells from 28 min to 40 min after exposure to 30 pM mTatP-QDs. The graph was created from 2.5-Hz TIRFM movies. (B to E) Maximum intensity projection (800 frames, 320 s) (B), trajectory of mTatP-QDs for 320 s (C) or the indicated time interval (D), and velocity-versus-time plots (E). The data were obtained from 2.5-Hz TIRFM movies. Temporary confinements are marked with pink circles. The numbers of temporal immobilizations of the trajectories in panel E correspond to numbers in panel D. Bars, 5 μm. The mTatP-QDs repeatedly visited the same microdomains (see zones 3, 6, and 9 or 7 and 10). The arrow in panel E shows the moment at which the QDs disappeared from the TIRFM image. See Movie S2 in the supplemental material. (F to H) Maximum intensity projection (F) and typical trajectories of mTatP-QDs during prolonged immobilization (G) obtained from 2.5-Hz TIRFM micrographs. Selected TIRFM frames (H, top panels) and surface plots (H, bottom panels). The arrowheads indicate immobilized QDs. Bars, 5 μm. Fluorescence intensity-versus-time plots (I) of the indicated immobilized QDs. Oblique lines, change in the average intensities. See Movie S3 in the supplemental material.
Fig 6
Fig 6
Single-molecule 4DM demonstrates the kinetics of mTatP-QDs immediately after internalization. (A) Stereomicrograph generated from 3D reconstructed images of mTatP-QDs on HeLa cells at 35 min after exposure to 3 pM mTatP-QDs. Use view glasses to see the 3D structure (left = red). (B) 3D trajectories of mTatP-QDs moving from the surface membrane to the nucleus. Two representative trajectories of mTatP-QDs from the selected areas in panel A are shown. The z axis corresponds to the line from the basal membrane to the nucleus, and the xy plane is parallel to the membrane. Bar, 10 μm.
Fig 7
Fig 7
Colocalization of the endosome-tracking dye DiO and TatP-QDs. (A) Colocalization studies of mTatP-QDs (red) and an endosome-tracking dye (DiO, green) that were codelivered into HeLa cells for 2 h. Arrows indicate the representative TatP molecules that did not colocalize with the DiO-labeled vesicles. Bar, 10 μm. (B) Intensity histogram of TatP-QDs inside endosomes fitted to two Gaussian curves (top). The mean of the first peak corresponds to single mTatP-QDs (bottom), defined as q1.
Fig 8
Fig 8
Effects of mTatP valence and the number of QDs/cell. (A to C) Velocity distributions of TatP on cells at 5 min and 25 min after exposure to 30 pM (A) or 3 pM (B) mTatP-QDs or 300 pM 2-val-TatP-QDs (C). (D) MSD curves on cells at 5 min and 25 min after exposure to the indicated conditions of TatP-QDs. The mean velocities (±SEM) were 2.16 ± 0.01 μm/s (30 pM mTatP for 5 min; n = 191), 2.13 ± 0.04 μm/s (3 pM mTatP for 5 min; n = 57, P = 0.96), 0.80 ± 0.01 μm/s (300 pM 2-val-TatP for 5 min; n = 251, P < 10−3), 0.18 ± 0.001 μm/s (30 pM mTatP for 25 min; n = 247), 0.15 ± 0.01 μm/s (3 pM mTatP for 25 min; n = 64, P = 0.94), and 0.72 ± 0.01 μm/s (300 pM 2-val-TatP for 5 min; n = 238, P < 10−4). The data were obtained from 10-Hz movies. The statistical significance was calculated with Dunnett's multiple comparison versus control.

Similar articles

Cited by

References

    1. Fawell S, Seery J, Daikh Y, Moore C, Chen LL, Pepinsky B, Barsoum J. 1994. Tat-mediated delivery of heterologous proteins into cells. Proc. Natl. Acad. Sci. U. S. A. 91:664–668 - PMC - PubMed
    1. Frankel AD, Pabo CO. 1988. Cellular uptake of the tat protein from human immunodeficiency virus. Cell 55:1189–1193 - PubMed
    1. Green M, Loewenstein PM. 1988. Autonomous functional domains of chemically synthesized human immunodeficiency virus Tat trans-activator protein. Cell 55:1179–1188 - PubMed
    1. Nagahara H, Vocero-Akbani AM, Snyder EL, Ho A, Latham DG, Lissy NA, Becker-Hapak M, Ezhevsky SA, Dowdy SF. 1998. Transduction of full-length TAT fusion proteins into mammalian cells: TAT-p27Kip1 induces cell migration. Nat. Med. 4:1449–1452 - PubMed
    1. Vives E, Brodin P, Lebleu B. 1997. A truncated HIV-1 Tat protein basic domain rapidly translocates through the plasma membrane and accumulates in the cell nucleus. J. Biol. Chem. 272:16010–16017 - PubMed

Publication types

MeSH terms

Substances

LinkOut - more resources