. 2013 Sep;12(9):2657-72.
doi: 10.1074/mcp.M112.026757. Epub 2013 Jun 3.

Autoantibody profiling in multiple sclerosis using arrays of human protein fragments

Affiliations

Autoantibody profiling in multiple sclerosis using arrays of human protein fragments

Burcu Ayoglu et al. Mol Cell Proteomics. 2013 Sep.

Abstract

Profiling the autoantibody repertoire with large antigen collections is emerging as a powerful tool for the identification of biomarkers for autoimmune diseases. Here, a systematic and undirected approach was taken to screen for profiles of IgG in human plasma from 90 individuals with multiple sclerosis related diagnoses. Reactivity pattern of 11,520 protein fragments (representing ∼38% of all human protein encoding genes) were generated on planar protein microarrays built within the Human Protein Atlas. For more than 2,000 antigens IgG reactivity was observed, among which 64% were found only in single individuals. We used reactivity distributions among multiple sclerosis subgroups to select 384 antigens, which were then re-evaluated on planar microarrays, corroborated with suspension bead arrays in a larger cohort (n = 376) and confirmed for specificity in inhibition assays. Among the heterogeneous pattern within and across multiple sclerosis subtypes, differences in recognition frequencies were found for 51 antigens, which were enriched for proteins of transcriptional regulation. In conclusion, using protein fragments and complementary high-throughput protein array platforms facilitated an alternative route to discovery and verification of potentially disease-associated autoimmunity signatures, that are now proposed as additional antigens for large-scale validation studies across multiple sclerosis biobanks.


Figures
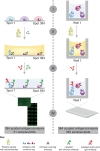
Fig. 1.
Fig. 1.
Schematic representation of the assay workflow on planar and bead-based antigen arrays for profiling autoantibody responses. Up to 384 different antigens either spotted on a glass slide or coupled to magnetic beads (I) are incubated with plasma sample containing autoantibodies (II). In the planar array format, the tag common for all antigens is detected with a chicken anti-tag antibody (II) followed by incubation with a labeled anti-chicken antibody (III). Potential autoantibodies are detected on both array platforms with a labeled anti-human IgG antibody (III). It is possible to analyze up to 21 plasma samples per slide or up to 384 plasma samples per plate on the planar or suspension bead array platform, respectively (IV).
Fig. 2.
Fig. 2.
Schematic summary of the multistage strategy by using two complementary antigen array platforms for antibody response profiling. Initial analysis of a pilot cohort consisting of 90 plasma samples was performed on the planar array platform, during which 30 batches of antigens, each consisting of 384 different antigens were spotted onto glass slides. This stage resulted in IgG reactivity profiles against a total of 11,520 antigens (Stage I). Combinations of statistical methods were applied to select candidate antigens, of which 384 antigens were subsequently challenged with technical verification on planar arrays by reprinting these 384 antigens and repeating the screening of the pilot cohort (Stage II). This was followed by coupling these antigens on magnetic beads to perform a biological verification in a larger cohort of 376 plasma samples using the suspension bead array platform (Stage III).
Fig. 3.
Fig. 3.
Representative IgG reactivity profiles. Signal intensities for 384 antigens within the same batch of antigens and the corresponding sample-specific intensity threshold are shown for two different RRrel samples (A) and (B). The same antigen shown in green was recognized both in samples (A) and (B), exceeding the different sample-specific intensity thresholds. Signal intensities across 30 batches of antigens, each batch consisting of 384 antigens, are shown for an RRrem (C) and an OND sample (D). Within each antigen batch, antigens in green were recognized exceeding the sample-specific thresholds of sample (C) and (D).
Fig. 4.
Fig. 4.
Analysis of global autoimmune reactivity and the heterogeneity of the plasma autoantibody profiles. During the discovery stage of the study, a pilot cohort of 90 plasma samples were screened to obtain the IgG reactivity profiles for a set of 11,520 antigens. Out of these antigens, 1,539 were recognized in no more than a single individual, whereas a small number of antigens were recognized in up to 64 individuals.
Fig. 5.
Fig. 5.
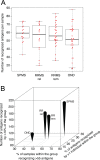
Distribution of autoimmune reactivity within ONDs and subgroups of MS. The red points in the boxplot (A) show the number of recognized antigens in each sample belonging to either the OND or an MS subtype group. The median number of recognized antigens within the MS subtypes and ONDs was not significantly different (Kruskal-Wallis test p value = 0.45), differing between a median of 52 antigens for OND, 56 for RRrem, 58 for RRrel, and 60 for SPMS. Sample groups were also investigated in terms of the number of antigens recognized by more than 10% of the group, percentage of antigens recognized by more than one individual and percentage of samples within the group recognizing more than 55 antigens, which is the median number of antigens recognized per sample across the entire cohort (B).
Fig. 6.
Fig. 6.
Representative reactivity profiles across experiments and array platforms. IgG reactivity profiles in terms of sample-specific relative signal intensity are shown against the verification set of 384 antigens (on x-axes) in three different plasma samples A–C. The first two profiles for each sample were obtained on planar array platform during the discovery and experimental verification stages (Stage I and II) and the last profile was obtained on the suspension bead array platform (Stage III). Concordance of reactivity could in general be observed on both array platforms and at least two stages of the study. Yet, detection of reactivity against certain antigens was platform-specific and could not be confirmed at multiple stages.
Fig. 7.
Fig. 7.
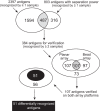
Strategy for the selection of antigens for verification and identification of differentially recognized targets on the two different array platforms. Analysis of the discovery sample cohort revealed a total of 2,397 antigens, which were recognized in one or more sample based on the sample-specific intensity threshold. At the same time, applying four different statistical methods to the entire antigen set revealed different lists with different number of antigens having a group separating power, either between ONDs and the entire MS group or between the different MS subtype groups. There were in total 803 antigens indicated by more than one out of the four methods. Out of these 803 antigens, 487 were among 2,397 antigens recognized by more than one sample. These 487 antigens were furthermore ranked based on number of samples recognizing them and a final list of 384 antigens were selected as the verification set. Fifty-six percent of these antigens could be verified on either of the planar or bead array platforms and 107 antigens, corresponding to around 28% of the verification set, could be verified on both array platforms. For 51 of these 107 antigens there were statistically significant differences in their recognition frequencies across different sample groups.
Fig. 8.
Fig. 8.
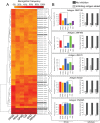
Recognition frequencies for 51 antigens within the different sample groups and inhibition assays demonstrating the specificity of autoantibody reactivity. The heatmap (A) summarizes the recognition frequencies within different MS subtypes, ONDs and the CIS group for 51 antigens, which were verified on both array platforms, at three stages and the differences in recognition frequency of these antigens were statistically significant (Fisher's exact test p value<0.05). Color intensity denotes the degree of recognition frequency for an antigen within the sample group. Recognition frequencies for five of these antigens within each subtype are shown in (B), each demonstrating a slightly different frequency pattern across different sample groups. Examples of significant differences in recognition frequencies are denoted either with a single (p value<0.05) or a double star (p value<0.01). Inhibition assays for this representative set of five antigens revealed that antigen-specific signals could be substantially reduced in all the samples (S1–S15) for each selected antigen, in which the reduced signal intensities varied between <1% (for PGAM5) and 36% (for ZNF70) (C).

References

    1. Goodnow C. C., Sprent J., Fazekas, de St Groth B., Vinuesa C. G. (2005) Cellular and genetic mechanisms of self tolerance and autoimmunity. Nature 435, 590–597 - PubMed
    1. Selmi C. (2011) Autoimmunity in 2010. Autoimmun. Rev. 10, 725–732 - PubMed
    1. Hueber W., Robinson W. H. (2006) Proteomic biomarkers for autoimmune disease. Proteomics 6, 4100–4105 - PubMed
    1. Gibson D. S., Banha J., Penque D., Costa L., Conrads T. P., Cahill D. J., O'Brien J. K., Rooney M. E. (2010) Diagnostic and prognostic biomarker discovery strategies for autoimmune disorders. J. Proteomics 73, 1045–1060 - PubMed
    1. Tjalsma H., Schaeps R. M., Swinkels D. W. (2008) Immunoproteomics: From biomarker discovery to diagnostic applications. Proteomics Clin. Appl. 2, 167–180 - PubMed

Publication types