. 2013:4:1938.
doi: 10.1038/ncomms2926.

Restricted perinatal retinal degeneration induces retina reshaping and correlated structural rearrangement of the retinotopic map

Affiliations
Free PMC article

Restricted perinatal retinal degeneration induces retina reshaping and correlated structural rearrangement of the retinotopic map

Nicola A Maiorano et al. Nat Commun. 2013.
Free PMC article

Abstract

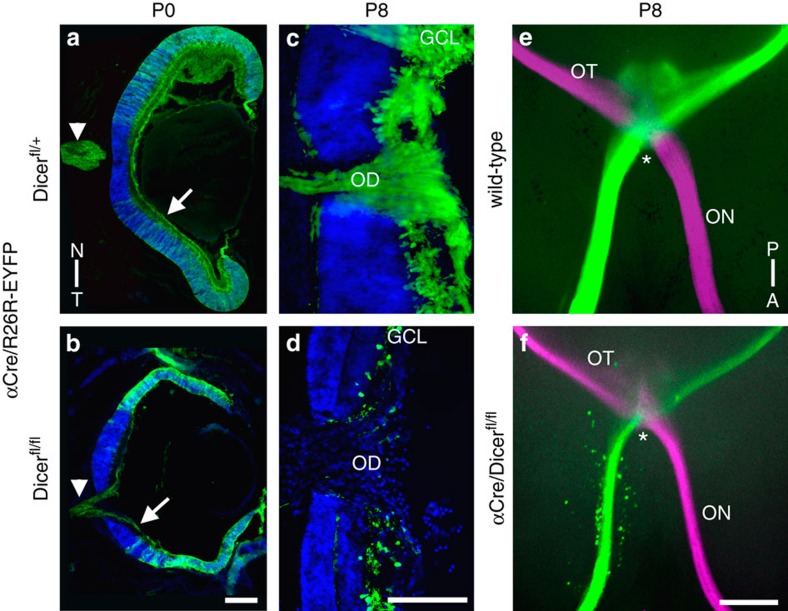
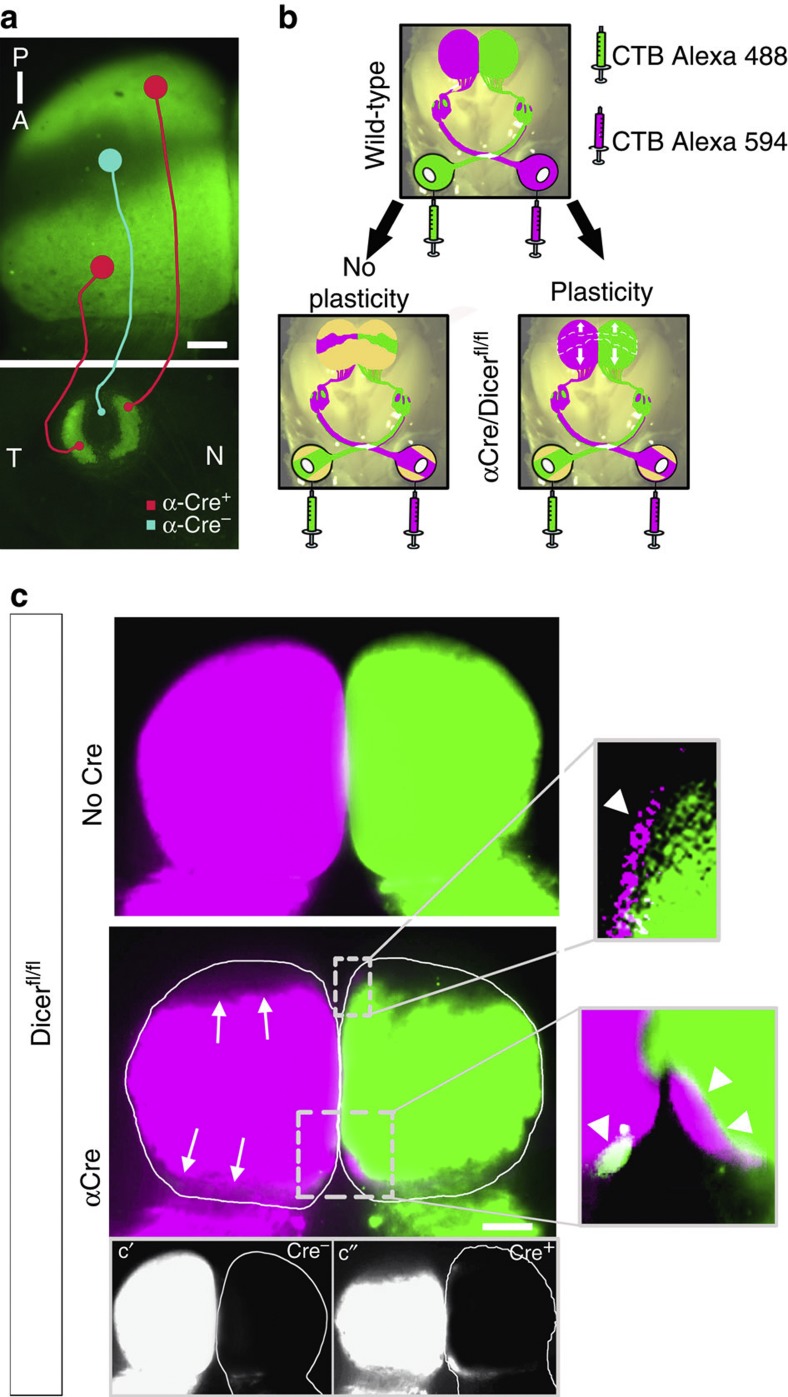
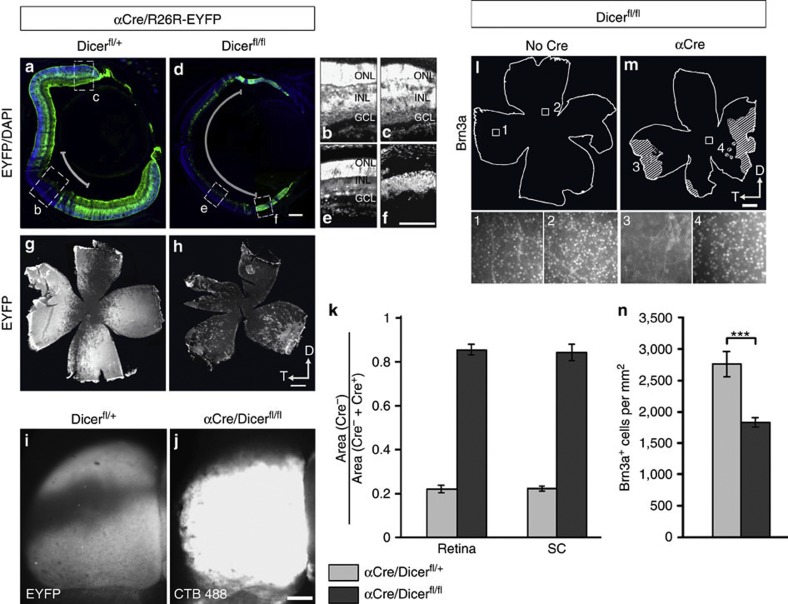
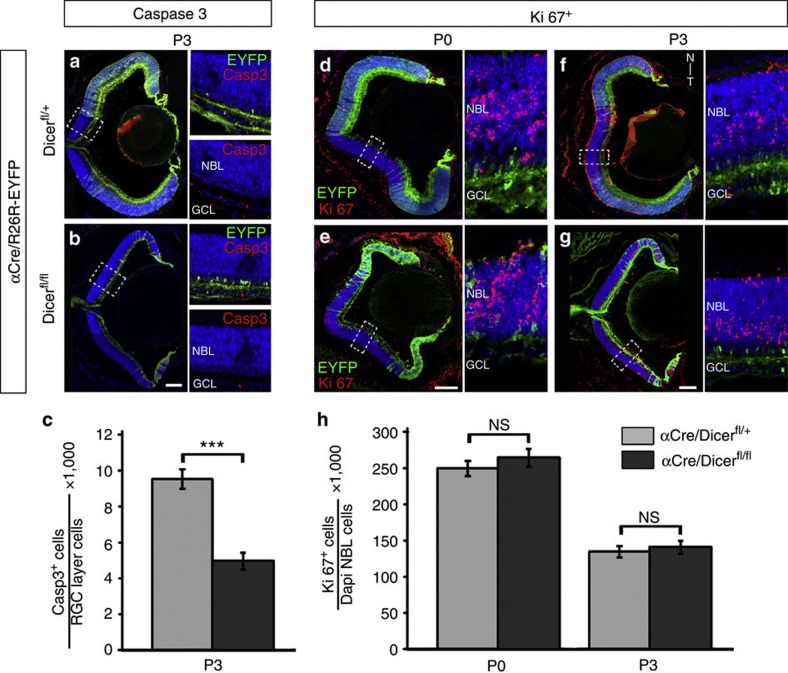
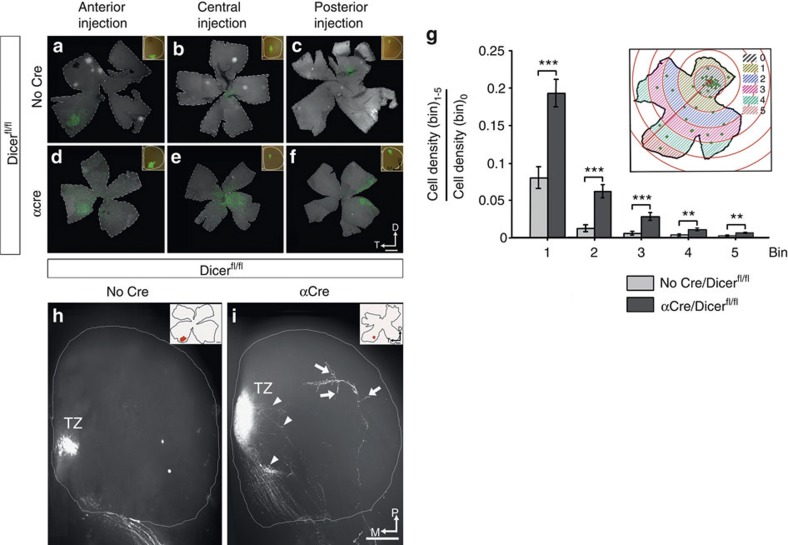
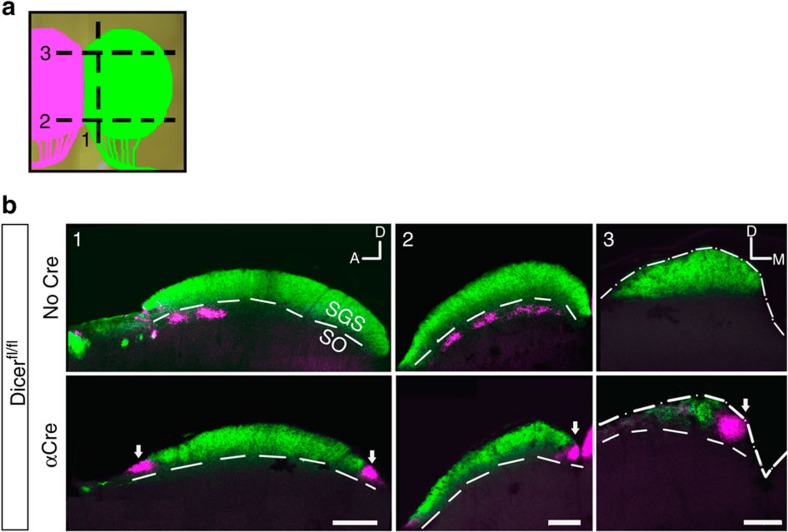
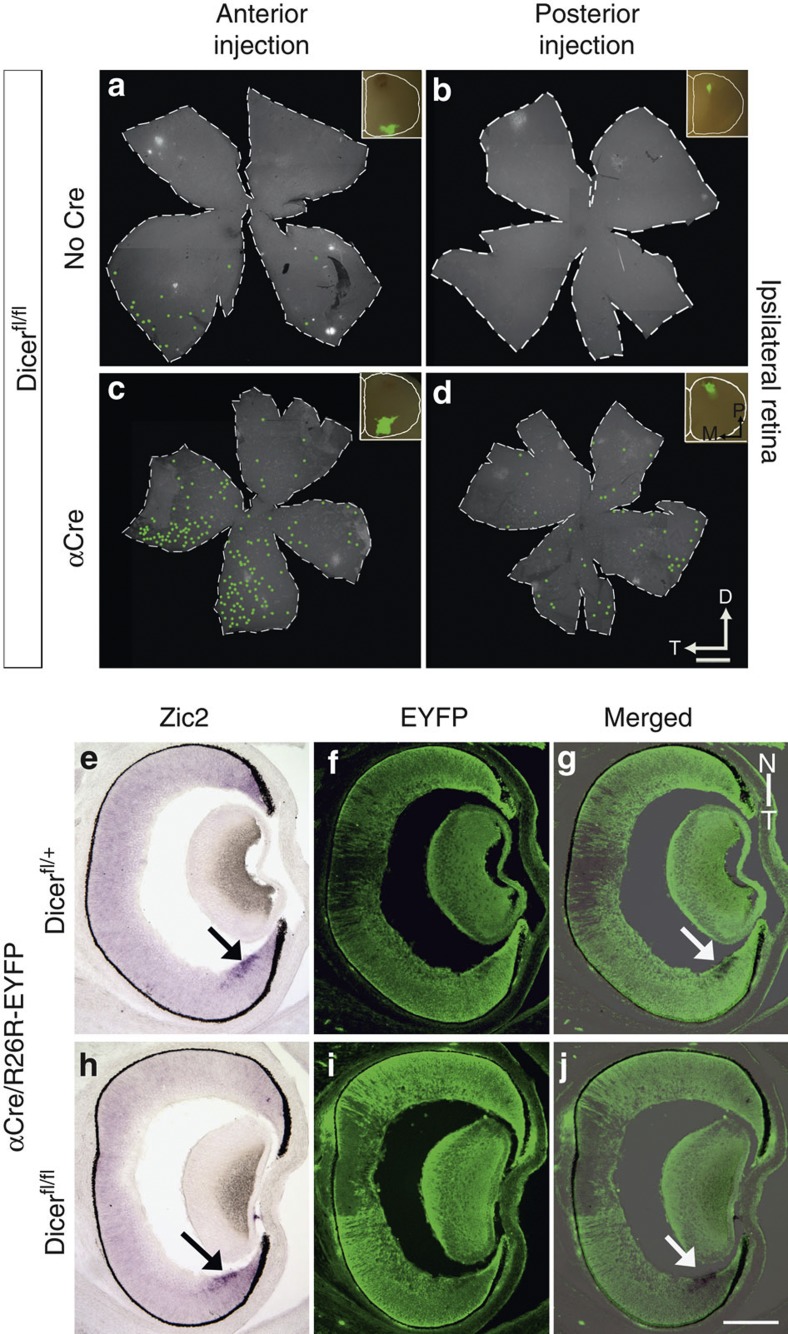
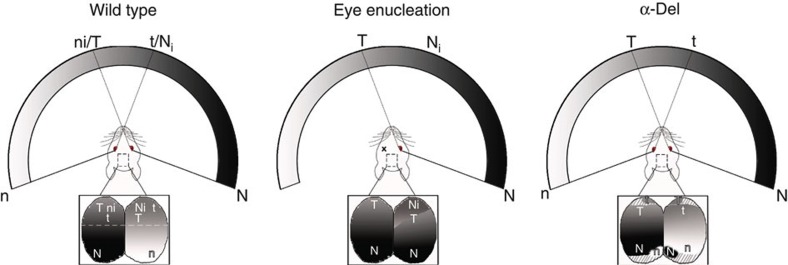
The formation of the retinotopic map depends on the action of axon guidance molecules, activity-dependent mechanisms and axonal competition. However, little is known about the plasticity potential of the system and the effects on the remodelling of retinocollicular connections upon retinal insults. Here we create a mouse model in which retinal ganglion cells that project to anterior and posterior superior colliculus undergo cell death during topographic map formation. We show that the remaining retinal ganglion cells expand the targeted area in the superior colliculus and at the same time increase their spatial coverage in the retina in a correlated fashion. The resulting contralateral topographic map is overall maintained but less precise, while ipsilateral retinal ganglion cell axons are abnormally distributed in anterior and posterior superficial superior colliculus. These results suggest the presence of plastic mechanisms in the developing mammalian visual system to adjust retinal space and its target coverage and ensure a uniform map.


Figures

Figure 1
Figure 1. Retinal Dicer1-deletion leads to lamination defects and RGC degeneration.
Cryosections of heterozygous control (a,c) and mutant (b,d) eyes and subsequent immunohistochemical analysis using anti-GFP (green) antibodies to visualize Cre-positive cells and DAPI counterstain (blue). (a,b) Retinal lamination and thickness are already affected at P0 in Dicer-deleted nasal and temporal retinal areas (b), but EYFP-positive axons coming from nasal and temporal peripheral retina are still present in the fibre layer (arrow) and in the optic nerve (arrowheads). (c,d) Higher magnifications of the optic discs (OD) in control (c) and mutant (d) mice at P8. In contrast to the controls (c), Dicer-negative (EYFP+) RGC axons have disappeared in mutant mice and no longer exit the OD (d). (e,f) Ventral whole-mount view of the optic chiasm (asterisks) under fluorescent illumination after full eye injections of CTB-Alexa-594 and 488 at P8. Wild-type mice show normal sized optic nerves (ON) and optic tracts (OT) (e). In contrast, mice with degenerated nasal and temporal retinal areas exhibit thinner ON and OT, but still forming a normal chiasm at the ventral midline (f). A–P; anterior–posterior; GCL, ganglion cell layer; N–T, nasal–temporal. Scale bar, 200 μm.
Figure 2
Figure 2. Retinal degeneration results in an extension of the remaining retinocollicular projections.
(a) Dorsal view of the SC (upper panel) and retina (lower panel) at P8 of a αCre+;Dicer+/fl;R26R-EYFP mouse illustrating the Cre-positive areas (green) in the retina and their termination areas in the SC. Nasal (N) and temporal (T) retinal areas map onto posterior (P) and anterior (A) SC, respectively (red lines), whereas the central retina (Cre-negative) maps onto the central SC (blue line). (b) Schematic describing possible outcomes of mapping behaviour of axons originating in remaining central retina, after degeneration of nasal and temporal areas. Without any plasticity (left panel), the RGC axons should map according to their topographic labels and the labelled SC area should thus be confined to the central area, similar to the Cre-negative area shown in (a). If plasticity is involved (right panel) an extension of the labelled area towards anterior and posterior SC is expected. (c) Dorsal view of the SC at P8 of a wild-type (upper panel) and α-Del mouse (lower panel) after full eye fills with CTB-Alexa-488 (green) and -594 (magenta). In wild-type mice, both colliculi are filled completely with axon terminations from the contralaleral eye. In contrast, mice with nasal and temporal degenerations exhibit an incomplete fill of the SC by the projections from contralateral RGCs, leaving some areas at the anterior and posterior end empty (arrows). In addition, small zones occupied by RGC axons originating from the ipsilateral retina are visible in each anterior and posterior SC (arrowheads, boxed areas and higher magnifications). Single channel images (Alexa-594) are shown in c′ and c′′ for increased contrast and signal detection. A–P, anterior–posterior; N–T nasal–temporal. Scale bar, 200 μm.
Figure 3
Figure 3. Genetic retinal lesions induce an expansion of the central retina and RGC projections in the SC.
(ah) Immunohistochemical detection of EYFP+ (Cre+, green) regions on cryosections (a,d) and flat mounts (g,h) in heterozygous controls and homozygous mutant retinae at P8, counterstained with DAPI (blue). Mutant retinae have an enlarged Cre-negative domain compared with wild-type or heterozygous control animals (curved lines in a,d). (b,c,e,f) Retinal lamination is the same for regions outside (b) and inside (c) the Cre-positive areas in control animals, but differs significantly in mutant mice presenting a normal lamination outside (e), but only a single thin layer of cells in the distal Cre-positive areas (f). (i) Dorsal view of a SC at P8 of control animals, stained against EYFP. The central EYFP-negative domain illustrates the area free of temporal and nasal RGC projections. (j) Dorsal view of a SC at P8 after full fills of the contralateral eye with CTB Alexa-488. RGC axons avoid the most anterior and posterior SC domains. (k) Relative Cre-negative index in retina and SC of control and α-Del mutant mice. Quantification shows that in control mice the Cre-negative index is 0.2 in both retina and SC (n=8 retinae and SCs, same animals). In contrast, in mutant mice this index reaches values above 0.8%, but stays correlated between retina and SC (n=8 retinae, n=9 SCs, different animals). (l,m) Immunohistochemical detection of Brn3a-positive cells in retinae from α-Del mutant and Cre-negative control mice at P8. Insets (14) illustrate Brn3a-positive cells in central and peripheral retina as shown in the camera lucida schematics. (n) Density quantification of Brn3a-positive cells for both genotypes. Unpaired Student’s t-test. (k,n) Values are mean±s.e.m. D, dorsal; GCL, ganglion cell layer; INL, inner nuclear layer; ONL, outer nuclear layer; T, temporal. Scale bar, 500 μm (g,h,l,m) and Scale bar, 200 μm (a,d,i,j).
Figure 4
Figure 4. Postnatal mutant lesioned retinae involves alterations in cell death rate.
Immunohistochemical detection of EYFP (green) and Caspase-3 (red) on P3 retina cryosections from control heterozygous (a) and α-Del mutant (b) mice, counterstained with the nuclear marker DAPI (blue). High magnification of boxed areas in (a,b) are shown to the right. (c) Quantification shows a 50% reduction of apoptotic cells in Cre-negative parts of the RGC layer of mutant mice, compared with control littermates. (dh) Immunohistochemical detection of EYFP (green) and proliferation marker Ki67 (red) on retina cryosections from control heterozygous (d,f) and mutant (e,g) mice, counterstained with the nuclear marker DAPI (blue). Both, at P0 (d,e) and P3 (f,g), the number of proliferating cells in the neuroblastic layer (NBL) of Cre-negative retinal areas is similar between mutant and control littermates. High magnifications of boxed areas are shown to the right. Quantifications are shown in (h). Values in (c,h) are mean±s.e.m; five fields for each different embryo (four embryos for each test) were analysed. Unpaired Student’s t-test ***P<0.001, NS, not significant; P>0.2. GCL, ganglion cell layer; N–T, nasal–temporal. Scale bar, 200 μm.
Figure 5
Figure 5. Retinotopic map of lesion-induced expanded projections is less precise.
(af) Whole retina flatmounts detecting RGCs after retrograde labelling using fluorescent microbeads injected in the contralateral SC of control (ac) or lesion-induced mutant mice (df) at P8. Injections were made in the anterior (a,d) (n=3 for both genotypes), central (b,e) (n=4 α-Del, n=5 wild-type) and posterior (c,f) (n=6 α-Del, n=5 wild-type) SCs of mice (insets) which result in labelled RGCs in temporal, central and nasal retina, respectively. α-Del mutant mice show general conservation of the topographic map, however, exhibit larger spread of retrogradely labelled cells. (g) Quantification of spread by binning the labelled RGCs in six concentric circles (0–5), centred around the point with highest RGCs density (0). The ratio of labelled cells was calculated for each bin (1–5) in relation to the number found in the central circle (0, schematic). Retinae from α-Del mutant mice showed a significantly higher spread for each bin compared with wild-type littermates. Sample passed Kolmogov–Smirnov test. Analysis of variance followed by Bonferroni post-hoc test was applied. (n=13 for both genotypes). Values are mean±s.e.m. ***P<0.001, **P<0.01. (h,i) Dorsal view of the SC of wild-type and α-Del mice at P8 after focal DiI injections into the contralateral eye. Ventral DiI injections lead to a TZ in medial SC in both genotypes. However, the lesion-induced mutant mice show consistently larger TZs with areas of loosely organized arborizations surrounding the TZ (arrowheads). In addition, several aberrant branches outside the appropriate TZ location are detected (arrows). Insets show the position of DiI injection in the retina (n=5 wild-type, n=2 α-Del). D, dorsal; M, medial; P, posterior; T, Temporal. Scale bar, 500 μm (af) and Scale bar, 200 μm (h,i).
Figure 6
Figure 6. Aberrant mapping of ipsilateral RGC axons.
(a) Schematic indicating the positions of parasagittal (1) and coronal (2-anterior, 3-posterior) sections through the SC depicted in (b) after full eye fills with CTB Alexa-488 (green, contralateral eye) and CTB Alexa-594 (magenta, ipsilateral eye). (b) Sections through the SC of wild-type mice (upper panels) at P8 show the ipsilateral projections (magenta) terminating discontinuously in only anterior positions of the SO below the dorsal-most SGS, which is occupied by contralateral projections (green). In lesion-induced mutant mice, two completely segregated TZs of ipsilateral RGC axons are found in the anterior and posterior SC (arrows). In addition, the terminations are not confined to the deeper SO, but are located incorrectly in the SGS. Dashed lines indicate border between SGS and SO, dashed-dotted lines indicate the dorsal SC border in (3). (n=4 wild-type controls, n=3 α-Del). A, anterior; D, dorsal; M, medial; P, posterior; R, rostral. Scale bar, 200 μm.
Figure 7
Figure 7. The origin of ipsilateral-projecting RGCs is not restricted to the ventral temporal crescent in α-Del animals.
(ad) Whole retina flatmounts detecting RGCs after retrograde labelling using fluorescent microbeads focally injected in the ipsilateral SC of control (a,b) or α-Del mutant mice (c,d) at P8. (a,b) In wild-type controls only injections into anterior ipsilateral SC resulted in retrogradely labelled RGCs in the retina, restricted exclusively to the ventral temporal crescent (VTC) (n=3). No labelled RGCs were detected upon injections in posterior (insets) ipsilateral SC (n=11). (c,d) In α-Del mice injections into both, anterior (c) and posterior (d) ipsilateral SC lead to retrogradely labelled RGCs in the retina. They are generally scattered across the retina, but show a location preference for the ventral temporal retina for anterior injections (c, n=3) and nasal retina for posterior SC injections (d, n=10). (ej) Panels show in situ hybridization using an antisense probe against Zic2 (purple) and immunohistochemical detection for EYFP (green) on E16 horizontal retinal sections, from control heterozygous (e,f) and mutant (h,i) mice. Merged images are shown in (g,j). Zic2-positive cells in the VTC (arrow) are located within the Cre-positive (EYFP+) retinal areas, which undergo degeneration in mutant mice at perinatal stages. D, dorsal; N, nasal; T, temporal; VTC, ventral temporal crescent. Scale bar, 500 μm (a,d) and Scale bar, 200 μm (e,j).
Figure 8
Figure 8. Schematic describing the representation of the visual field in the SC in different rodent models.
Capitals and lower case letters illustrate zones of the visual field and corresponding retinocollicular projections, which are relative to right and left retina, respectively. The subscript ‘i’ indicates the furthest point of the visual field represented through the nasal border of the ipsilateral-projecting VTC of the retina. In wild-type animals, the zone of binocularity seen by the temporal retina is uniquely represented in the anterior SC so that ipsilateral projections result in an opposing polarity of topographic map (nasal–temporal retina projecting to anterior–posterior SC) relative to contralateral projections (temporal–nasal retina projecting anterior–posterior SC). In animals that undergo eye enucleation at birth, the ipsilateral fibers project continuously in the SC from across the retina with two polarities: an appropriate retinotopic map for normal ipsilateral projections in the anterior SC (nasal–temporal retina projecting anterior–posterior SC) and some aberrant projections in posterior SC by nasal retinal axons. In our genetic lesion mutants (α-Del), contralateral projections form a generally appropriate topographic map, although less refined. In addition, they are unable to innervate the entire SC, leaving an anterior and posterior zone empty. Instead, RGC axons from the ipsilateral eye are occupying some of this empty space and form TZs in anterior and posterior SC, mapping according to contralateral retinotopic polarity. As a result, opposite temporal extremities of the visual fields (‘seen’ by the nasal poles of each retina) map adjacently in the posterior SC.

References

    1. Feldheim D. A. & O’Leary D. D.. Visual map development: bidirectional signaling, bifunctional guidance molecules, and competition. Cold Spring Harb. Perspect. Biol. 2, a001768 (2010) . - PMC - PubMed
    1. Hindges R., McLaughlin T., Genoud N., Henkemeyer M. & O’Leary D. D.. EphB forward signaling controls directional branch extension and arborization required for dorsal-ventral retinotopic mapping. Neuron 35, 475–487 (2002) . - PubMed
    1. Xu H. P. et al.. An instructive role for patterned spontaneous retinal activity in mouse visual map development. Neuron 70, 1115–1127 (2011) . - PMC - PubMed
    1. Zhang J., Ackman J. B., Xu H. P. & Crair M. C.. Visual map development depends on the temporal pattern of binocular activity in mice. Nat. Neurosci. 15, 298–307 (2012) . - PMC - PubMed
    1. Drager U. C. & Olsen J. F.. Origins of crossed and uncrossed retinal projections in pigmented and albino mice. J. Comp. Neurol. 191, 383–412 (1980) . - PubMed

Publication types

LinkOut - more resources