. 2013 Sep;31(9):1932-41.
doi: 10.1002/stem.1442.

PDGF signaling is required for primitive endoderm cell survival in the inner cell mass of the mouse blastocyst

Affiliations

PDGF signaling is required for primitive endoderm cell survival in the inner cell mass of the mouse blastocyst

Jérôme Artus et al. Stem Cells. 2013 Sep.

Abstract

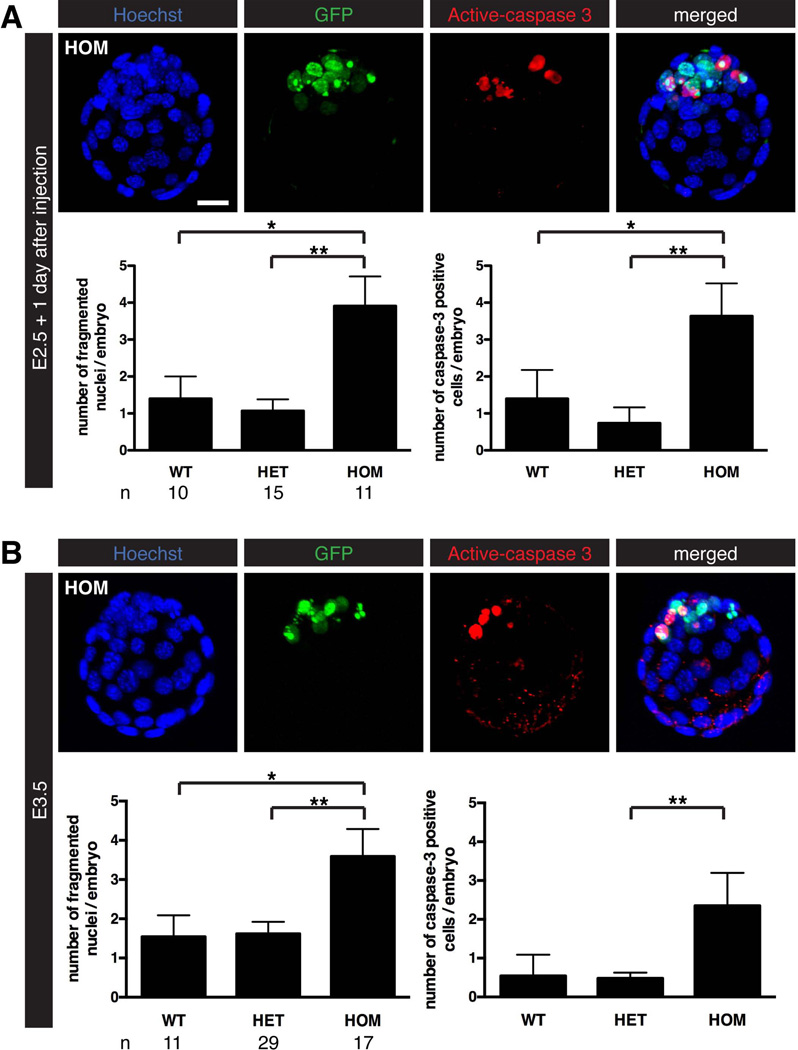
At the end of the preimplantation period, the inner cell mass (ICM) of the mouse blastocyst is composed of two distinct cell lineages, the pluripotent epiblast (EPI) and the primitive endoderm (PrE). The current model for their formation involves initial co-expression of lineage-specific markers followed by mutual-exclusive expression resulting in a salt-and-pepper distribution of lineage precursors within the ICM. Subsequent to lineage commitment, cell rearrangements and selective apoptosis are thought to be key processes driving and refining the emergence of two spatially distinct compartments. Here, we have addressed a role for Platelet Derived Growth Factor (PDGF) signaling in the regulation of programmed cell death during early mouse embryonic development. By combining genetic and pharmacological approaches, we demonstrate that embryos lacking PDGF activity exhibited caspase-dependent selective apoptosis of PrE cells. Modulating PDGF activity did not affect lineage commitment or cell sorting, suggesting that PDGF is involved in the fine-tuning of patterning information. Our results also indicate that PDGF and fibroblast growth factor (FGF) tyrosine kinase receptors exert distinct and non-overlapping functions in PrE formation. Taken together, these data uncover an early role of PDGF signaling in PrE cell survival at the time when PrE and EPI cells are segregated.

Keywords: Apoptosis; Blastocyst; Mouse embryo; PDGF signaling; Primitive endoderm.


Conflict of interest statement

DISCLOSURE OF POTENTIAL CONFLICTS OF INTEREST

The authors indicate no potential conflicts of interest.

Figures

Figure 1
Figure 1. Increased apoptosis in blastocyst embryos lacking Pdgfra
Analysis of cell death in E2.5 embryos recovered one day after tamoxifen injection (A) and in E3.5 embryos (B). Embryos were recovered from PdgfraH2B-GFP/+ intercrosses, processed for immunostaining, imaged and subsequently genotyped, as previously described . Upper panels represent 3D-rendering of a PdgfraH2B-GFP/H2B-GFP embryo. Lower panels represent distribution of fragmented nuclei and Caspase-3 positive cells in Pdgfra+/+ (WT), PdgfraH2B-GFP/+ (HET) and PdgfraH2B-GFP/H2B-GFP (HOM) embryos at E2.5+1 day after tamoxifen injection and E3.5. Only E3.5 blastocysts with a total cell number ranging from 60 to 120 cells were analyzed. This corresponds to the time when ICM cells are committed towards PrE and EPI cell fates. GFP, green; active Caspase-3, red; Hoechst, blue. Scale bar: 20 μm. Statistical Mann-Whitney tests are indicated when significant (*, P<0.05; **, P<0.01). Error bars indicate s.e.m. n, number of embryos analyzed.
Figure 2
Figure 2. Live imaging reveals increased cell death of inner PrE cells in Pdgfra-deficient embryos
(A) Single frames from 3D time-lapse sequence of ICM of a PdgfraH2B-GFP/H2B-GFP E3.5 mid-blastocyst embryo. Cell death events occurring in GFP-positive cells are depicted either with a red (inner PrE cell) or blue arrowhead (outer PrE cell). Annotated movie sequence is provided as Movie 1. GFP, green. Scale bar: 10 μm. (B) Numbers of cell death events in HET and HOM embryos. Statistical Mann-Whitney test is indicated when significant (***, P<0.001). Error bars indicate s.e.m. n, number of analyzed embryos. (C, D) Localization of PrE cells prior to death within ICM of HET (C) or HOM (D) embryos. IN, inside; OUT, outside; ND, not determined. Numbers indicate number of cells analyzed.
Figure 3
Figure 3. Gleevec treatment affects preimplantation development
(A) Schematic representation of timeline of Gleevec treatment. (B) Single optical sections of embryos cultured at indicated concentrations of Gleevec. bf, brightfield; Hoechst, blue. Scale bar: 20 μm, n, number of analyzed embryos. (C) Distribution of TE (green), PrE (blue) and EPI (red) cells in E2.5, early and mid E3.5 embryos cultured with or without Gleevec until E4.5. Statistical Mann-Whitney tests are indicated when significant (*, P<0.05; **, P<0.01; ***, P<0.001). Error bars indicate s.e.m.
Figure 4
Figure 4. Gleevec treatment phenocopies Pdgfra inactivation
(A) Single frames from 3D time-lapse sequence of ICM of a Pdgfra+/H2B-GFP mid E3.5 blastocyst embryo cultured in 5 μM Gleevec. Cell death events occurring in GFP-positive cells are depicted either with a red (inner PrE cell), a blue (outer PrE cell) or a grey arrowhead (undetermined localization). Annotated movie sequence is provided as Movie 4. GFP, green. Scale bar: 10 μm. (B-D) Localization of PrE cells prior to cell death within the ICM of control early E3.5 (B), Gleevec-treated early (C) and mid (D) E3.5 blastocyst embryos. IN, inside; OUT, outside; ND, not determined. Numbers indicate number of cells analyzed.
Figure 5
Figure 5. Caspase inhibition rescues the phenotype resulting from the loss of Pdgfra
(A) 3D rendering of Pdgfra+/H2B-GFP (HET) and PdgfraH2B-GFP/H2B-GFP (HOM) early blastocyst embryos cultured 24 hours in DMSO or 20 μM Z-VAD. GFP, green; GATA4, red; Hoechst, blue. Scale bar: 20 μm. (B-E) Distribution of total (B), TE (C), EPI (D) and PrE (E) cells in wild-type (WT), heterozygous (HET) and mutant (HOM) embryos cultured in DMSO or 20 μM Z-VAD. n, number of embryos analyzed. Statistical Mann-Whitney tests are indicated when significant (*, P<0.05; **, P<0.01). Error bars indicate s.e.m.
Figure 6
Figure 6. Overexpression of PDGF-A ligand does not affect sorting of PrE cells
(A) Schematic representation of plasmid DNA electroporation. (B) Average number of mCHERRY-positive cells per embryo. n, number of electroporated embryos. Error bars indicate s.e.m. (C) 3D-rendering of blastocyst embryos co-electroporated with pCAG::H2B-mCherry and pCAGGS or pCAG::Pdgfa vectors. GATA4, green; mCHERRY, red; Hoechst, blue. Scale bar: 20 μm.

References

    1. Brill A, Torchinsky A, Carp H, et al. The role of apoptosis in normal and abnormal embryonic development. J Assist Reprod Genet. 1999;16:512–519. - PMC - PubMed
    1. Doseff AI. Apoptosis: the sculptor of development. Stem Cells Dev. 2004;13:473–483. - PubMed
    1. Mondello C, Scovassi AI. Subcellular Biochemistry. Dordrecht: Springer Netherlands; 2009. pp. 1–17.
    1. El-Shershaby AM, Hinchliffe JR. Cell redundancy in the zona-intact preimplantation mouse blastocyst: a light and electron microscope study of dead cells and their fate. J Embryol Exp Morphol. 1974;31:643–654. - PubMed
    1. Potts DM, Wilson IB. The preimplantation conceptus of the mouse at 90 hours post coitum. J Anat. 1967;102:1–11. - PMC - PubMed

Publication types

MeSH terms