Review
. 2013 Jun;194(2):301-26.
doi: 10.1534/genetics.112.148825.

Identity by descent: variation in meiosis, across genomes, and in populations

Affiliations
Review

Identity by descent: variation in meiosis, across genomes, and in populations

Elizabeth A Thompson. Genetics. 2013 Jun.

Abstract

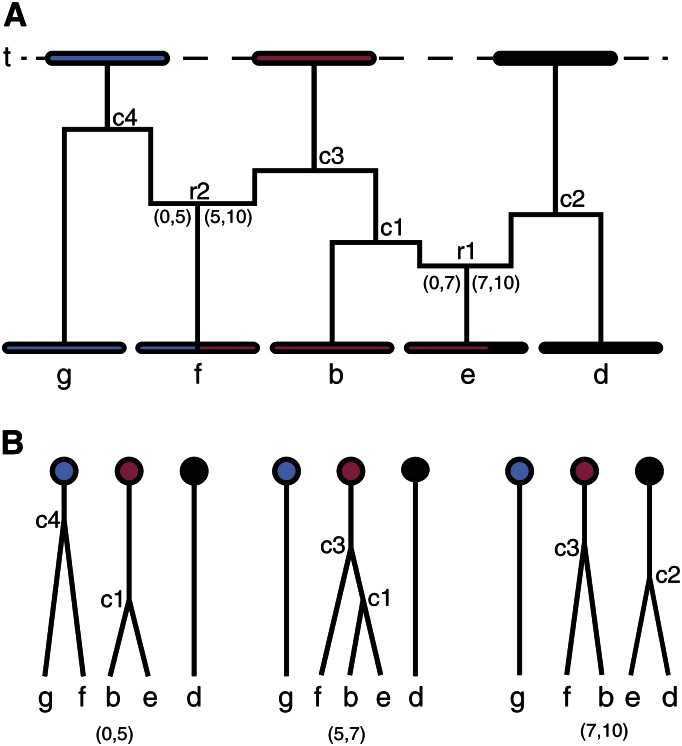
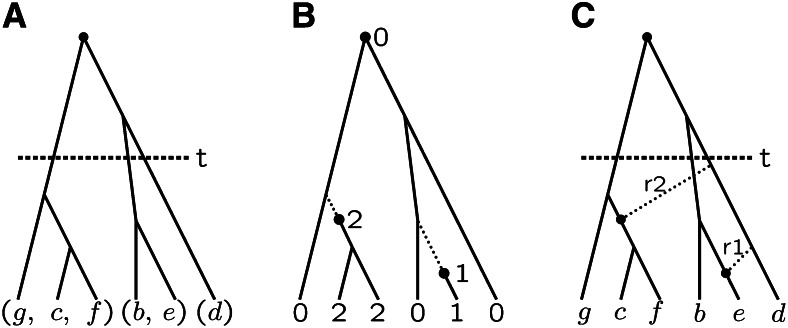
Gene identity by descent (IBD) is a fundamental concept that underlies genetically mediated similarities among relatives. Gene IBD is traced through ancestral meioses and is defined relative to founders of a pedigree, or to some time point or mutational origin in the coalescent of a set of extant genes in a population. The random process underlying changes in the patterns of IBD across the genome is recombination, so the natural context for defining IBD is the ancestral recombination graph (ARG), which specifies the complete ancestry of a collection of chromosomes. The ARG determines both the sequence of coalescent ancestries across the chromosome and the extant segments of DNA descending unbroken by recombination from their most recent common ancestor (MRCA). DNA segments IBD from a recent common ancestor have high probability of being of the same allelic type. Non-IBD DNA is modeled as of independent allelic type, but the population frame of reference for defining allelic independence can vary. Whether of IBD, allelic similarity, or phenotypic covariance, comparisons may be made to other genomic regions of the same gametes, or to the same genomic regions in other sets of gametes or diploid individuals. In this review, I present IBD as the framework connecting evolutionary and coalescent theory with the analysis of genetic data observed on individuals. I focus on the high variance of the processes that determine IBD, its changes across the genome, and its impact on observable data.


Figures

Figure 1
Figure 1
Partial ancestral recombination graph to reference time t, showing the successive IBD segments among five current gametes. The chromosome is 10 cM and indexed by a continuous range of positions from 0 to 10. The four coalescent events are marked as c1 to c4. Two recombination events occur in the ancestry of these chromosomes, at positions 5 and 7. These events are marked as r1 and r2.
Figure 2
Figure 2
IBD: (A) in the coalescent ancestry relative to time depth t, (B) relative to mutational origins on the coalescent ancestry, and (C) changing due to recombination. For details, see text.
Figure 3
Figure 3
The IBD graph at a single genome location on nine observed individuals, labeled by letters A, B, …. The numbered nodes represent distinct non-IBD DNA at this locus, and the individual edges connect the two DNA nodes that an individual carries. Individuals C is autozygous, carrying two copies of the DNA-node 6. Individuals B and J share both their genomes IBD at this locus.
Figure 4
Figure 4
The effect of explosive population growth on the proportion of IBD genome. (A) Human world population growth over the past 2000 years. (B) The increasing rate of increase of the human population. (C) The pointwise probability of genome-shared IBD in randomly sampled chromosomes, relative to past time points.
Figure 5
Figure 5
The effect of explosive population growth on the numbers and counts of newly arising variants, under three population scenarios: explosive population growth (blue), equivalent exponential growth (red), and in a constant population (green). (A) Variants arising (solid lines) and surviving (dashed lines) as a function of time of origin. (B) Expected numbers of copies of each surviving variant as a function of time of origin. (C) The age probability distributions of variants currently present in 10 (solid lines) and 120 (dashed lines) copies.
Figure 6
Figure 6
Resolving components of IBD graphs from pairwise IBD. (A) For three individuals A, B, and C, with each pair sharing a gamete IBD, the joint sharing can be resolved in two ways. (B) If D also shares a gamete IBD with each of A, B, and C, then all four individuals must share a single gamete.
Figure 7
Figure 7
Possible components of an IBD graph used in genetic mapping, showing only individuals involved in some IBD sharing. The IBD graph may derive from the analysis of marker data on a pedigree or on individuals samples from a population. (A) A binary trait with affected (A) and unaffected (U) individuals. (B) A quantitative trait, with the trait values of individuals shown. In both cases, at this hypothesized locus, phenotypic similarity is associated with IBD.

References

    1. 1000 Genomes Project Consortium 2010. A map of human genome variation from population-scale sequencing. Nature 467: 1061–1073. - PMC - PubMed
    1. Abecasis G. R., Cherny S. S., Cookson W. O., Cardon L. R., 2002. Merlin – rapid analysis of dense genetic maps using sparse gene flow trees. Nat. Genet. 30: 97–101. - PubMed
    1. Albers C. A., Stankovic J., Thomson R., Bahlo M., Kappen H. J., 2008. Multipoint approximations of identity-by-descent probabilities for accurate linkage analysis of distantly related individuals. Am. J. Hum. Genet. 82: 607–622. - PMC - PubMed
    1. Albrechtsen A., Korneliussen T. S., Moltke I., van Overseem Hansen T., Nielsen F. C., et al. , 2009. Relatedness mapping and tracts of relatedness for genome-wide data in the presence of linkage disequilibrium. Genet. Epidemiol. 33: 266–274. - PubMed
    1. Albrechtsen A., Moltke I., Nielsen R., 2010. Natural selection and the distribution of identity-by-descent in the human genome. Genetics 186: 295–308. - PMC - PubMed

Publication types