. 2013 Jul 1;191(1):145-53.
doi: 10.4049/jimmunol.1203165. Epub 2013 Jun 3.

Fetal-maternal alignment of regulatory T cells correlates with IL-10 and Bcl-2 upregulation in pregnancy

Affiliations

Fetal-maternal alignment of regulatory T cells correlates with IL-10 and Bcl-2 upregulation in pregnancy

Brigitte Santner-Nanan et al. J Immunol. .

Abstract

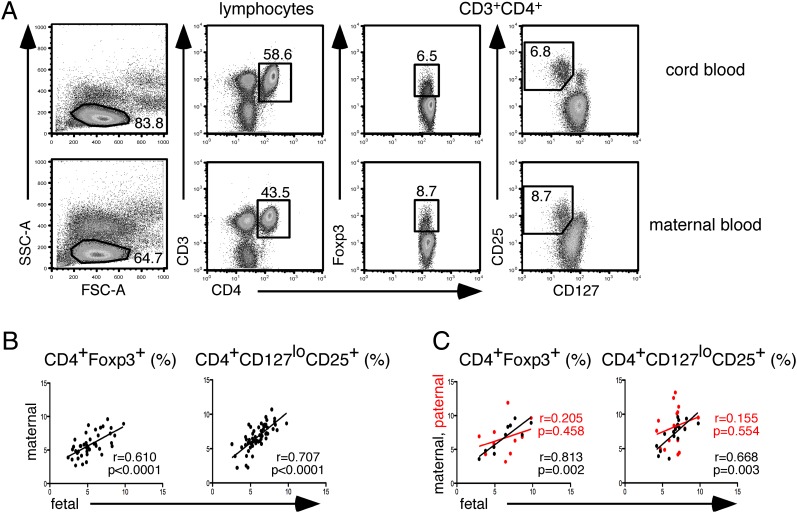
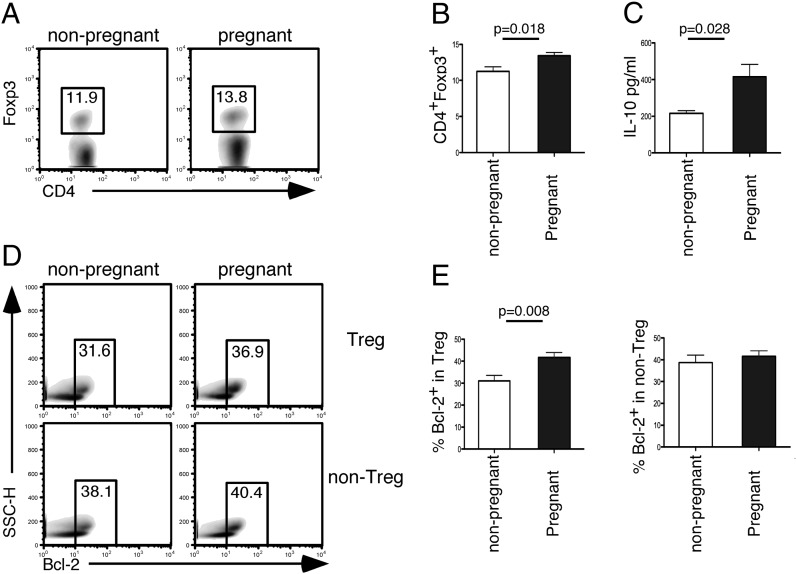
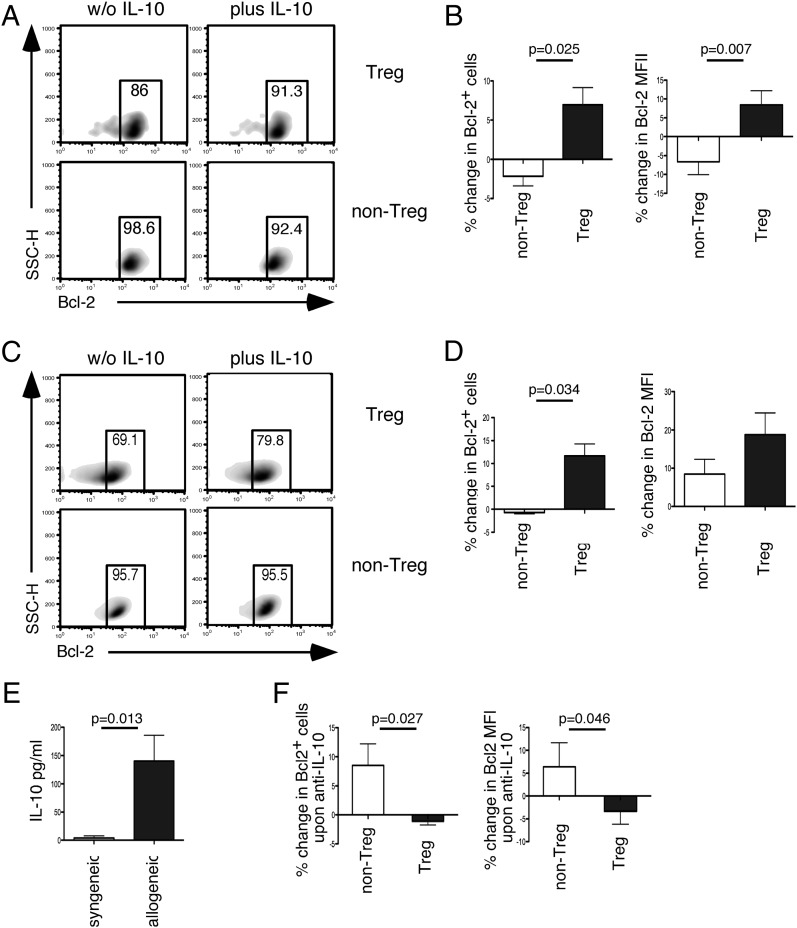
Transplacental immune regulation refers to the concept that during pregnancy, significant cross-talk occurs between the maternal and fetal immune system with potential long-term effects for both the mother and child. In this study, we made the surprising observation that there is a strong correlation of peripheral blood regulatory T (Treg) cells between the mother and the fetus. In contrast, there is no significant Treg cell correlation between paternal fetal dyads (pairs), suggesting that the specific context of pregnancy, rather than the genetic parental similarity to the fetus, is responsible for this correlation. Gene microarray analysis of Treg cells identified a typical IL-10-dependent signature in maternal and fetal Treg cells. In addition, a direct correlation of serum IL-10 protein levels between maternal fetal dyads was observed. Furthermore, we show that maternal serum IL-10 levels correlate with serum estradiol and estriol, implicating hormonal involvement in this alignment. Interestingly, we show that Treg cells possess higher expression of IL-10 receptor α and that Treg cell IL-10 receptor α expression directly correlates with their Bcl-2 expression. Indeed, in vitro data in both humans and mice demonstrate that IL-10 upregulates Bcl-2 specifically in Treg cells but not non-Treg cells. Our results provide evidence for transplacental regulation of cellular immunity and suggest that IL-10 may influence Treg cell homeostasis through its effect on Treg cell Bcl-2 expression. These novel findings have important implications on immune tolerance in pregnancy and beyond in areas of autoimmunity, allergy, and transplantation.


Figures

FIGURE 1.
FIGURE 1.
Correlation of peripheral blood maternal, paternal, and fetal Treg cell frequencies. (A) Gating strategy for defining Foxp3+ and CD127lloCD25+ Treg cells within CD4+ T cells. (B) Scatter plot of Treg cell frequencies in term maternal fetal dyads, n = 44 for CD4+ Foxp3+, n = 59 for CD4+CD127loCD25+. (C) Scatterplot comparing paternal (red dots) and maternal (black dots) fetal dyads, n = 11 for CD4+Foxp3+, n = 17 for CD4+CD127loCD25+. In all cases, correlation was calculated using Pearson's correlation coefficient, r, and p values as indicated.
FIGURE 2.
FIGURE 2.
Gene signatures of maternal Treg cells during pregnancy indicate the involvement of IL-10 signaling pathway. (A) Representative density plots of sorting purities of Treg and non-Treg cells in nonpregnant and pregnant samples. Scatter plots of global gene expression comparing Treg and non-Treg cells in both study groups, followed by a Venn diagram showing the number of differentially expressed genes between Treg and non-Treg cells in nonpregnant (red circle) and pregnant (blue circle) women. A distinct subset of 93 genes is both Treg cell and pregnancy specific. These 93 genes were subjected to pathway analysis, where threshold of determining significant gene sets is <0.005. The IL-10 signaling pathway was the most significant immune response pathway. (B) PCA was performed on the 93 genes. This showed separations between nonpregnant and pregnant groups (principal component 1 [PC1]). Separation was also observed between non-Treg and Treg cells (principal component 2 [PC2]).
FIGURE 3.
FIGURE 3.
Correlation of IL-10 at a protein level in maternal-fetal dyads. (A) Scatter plots of serum levels of IL-10 (pg/ml) (n = 37), IL-6 (pg/ml) (n = 33), and TGF-β (ng/ml) (n = 38). (B) Comparison of serum IL-10, IL-6, and TGF-β levels in maternal blood (▪) and cord blood (□). Paired t test was used, p values as indicated. (C) Correlation between E2 and E3 and IL-10 in maternal serum during pregnancy. (D) Scatter plots of percentages of various intracellular cytokines expressed in CD3+CD8 T cells in maternal fetal dyads. IL-10, IFN-γ, and IL-17 (n = 30), IL-4 (n = 19), and IL-22 (n = 20). Correlations between maternal fetal dyads were calculated using Pearson’s correlation coefficient, r, and p values as indicated.
FIGURE 4.
FIGURE 4.
IL-10RA expression ex vivo. (A) Representative Histograms showing IL-10RA MFI in CD4+Foxp3+ Treg and CD4+Foxp3 non-Treg cells in cord blood (CB), maternal blood (MB), and in nonpregnant (NP) women. A summary of MFI values within non-Treg and Treg cells are shown as individual dots from the three cohorts, CB (n = 20), MB (n = 19), and NP (n = 18), with the bar representing the mean. Paired t test, p values as indicated. (B) Correlation of IL-10RA and Bcl-2 expression in CD4+Foxp3+ Treg cells. Pearson’s correlation coefficient, r, and p values as indicated. (C) Summary plots with mean values, showing Bcl-2 MFI in Foxp3+ Treg cells in NP versus pregnant individuals (n = 20). (D) Correlation of Bcl-2 MFIs in CD4+Foxp3+ Treg cells between CB and corresponding MB (n = 19). Pearson’s correlation coefficient, r, and p values as indicated.
FIGURE 5.
FIGURE 5.
Significantly higher percentages of Bcl-2+ cells within the expanding Treg cell population in pregnant CBA/J mice. (A) Representative density plots showing frequencies of CD4+Foxp3+ from splenocytes of nonpregnant versus pregnant CBA/J mice. (B) Summary bar graph (mean ± SEM) showing percentage of CD4+Foxp3+ cells, from nonpregnant (n = 8) or pregnant (n = 7) animals from CBA/J × BALB/c matings on day 8 of pregnancy. (C) Summary bar graph (mean ± SEM) showing IL-10 levels (pg/ml) in serum from nonpregnant (n = 4) or pregnant (n = 4) animals from CBA/J × BALB/c matings on day 8 of pregnancy. (D) Representative density plots of the Bcl-2 gating strategy in nonpregnant versus pregnant Treg and non-Treg cells. The full gating strategy applied is detailed in Supplemental Fig. 2. (E) Summary bar graph (mean ± SEM) of cells in pregnant versus nonpregnant mice. Paired t test, p values as indicated.
FIGURE 6.
FIGURE 6.
Differential effects of IL-10 on Bcl-2 expression in Treg and non-Treg cells in vitro. (A) Representative density plots showing expression of Bcl-2 in the presence or absence of 200 IU/ml IL-10 cocultured human non-CFSE labeled CD4+ CD127loCD25+ Treg and CFSE-labeled CD4+CD127hiCD25 non-Treg cells. Cells were stimulated with CD3/CD28 Abs and analyzed on day 3. (B) Summary bar graph (mean ± SEM) showing percentage of change in Bcl-2+ cells as well as percentage change in Bcl-2 MFI levels within these two subsets. Data are shown from seven independent experiments. (C) Representative flow cytometry staining showing expression of Bcl-2 in cocultured CD4+GFP+ Treg cells and CD4+GFP non-Treg cells isolated from splenocytes of DEREG BALB/c mice with and without 400 IU/ml IL-10 plus anti-CD3/CD28. (D) Summary bar graphs (mean ± SEM) showing percentage of change in Bcl-2+ cells and percentage of change in Bcl-2 MFI levels. Data are shown from 3 independent experiments. (E) Summary bar graph (mean ± SEM) showing IL-10 level (pg/ml) in supernatant from splenocytes from female CBA/J mice stimulated with irradiated slenocytes from syngeneic CBA/J males or allogeneic BALB/c males. Data show eight and nine animals, respectively, in each group. (F) Summary bar graph (mean ± SEM) showing percentage of change in Bcl-2+ cells upon anti–IL-10 treatment as well as Bcl-2 MFI’s in cells from female CBA/J mice, stimulated with irradiated allogeneic male BALB/c lymphocytes. Data show 11 animals in each group.

References

    1. Malassiné A., Frendo J. L., Evain-Brion D. 2003. A comparison of placental development and endocrine functions between the human and mouse model. Hum. Reprod. Update 9: 531–539 - PubMed
    1. Firan M., Bawdon R., Radu C., Ober R. J., Eaken D., Antohe F., Ghetie V., Ward E. S. 2001. The MHC class I-related receptor, FcRn, plays an essential role in the maternofetal transfer of gamma-globulin in humans. Int. Immunol. 13: 993–1002 - PubMed
    1. Loubière L. S., Lambert N. C., Flinn L. J., Erickson T. D., Yan Z., Guthrie K. A., Vickers K. T., Nelson J. L. 2006. Maternal microchimerism in healthy adults in lymphocytes, monocyte/macrophages and NK cells. Lab. Invest. 86: 1185–1192 - PubMed
    1. Mold J. E., Michaëlsson J., Burt T. D., Muench M. O., Beckerman K. P., Busch M. P., Lee T.-H., Nixon D. F., McCune J. M. 2008. Maternal alloantigens promote the development of tolerogenic fetal regulatory T cells in utero. Science 322: 1562–1565 - PMC - PubMed
    1. Macaubas C., de Klerk N. H., Holt B. J., Wee C., Kendall G., Firth M., Sly P. D., Holt P. G. 2003. Association between antenatal cytokine production and the development of atopy and asthma at age 6 years. Lancet 362: 1192–1197 - PubMed

Publication types

MeSH terms

Associated data