

Global human appropriation of net primary production doubled in the 20th century
- PMID: 23733940
- PMCID: PMC3690849
- DOI: 10.1073/pnas.1211349110
Global human appropriation of net primary production doubled in the 20th century
Abstract
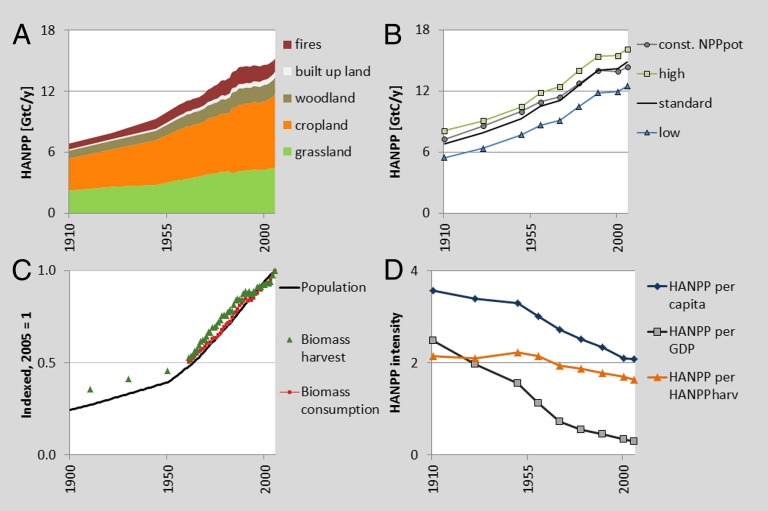
Global increases in population, consumption, and gross domestic product raise concerns about the sustainability of the current and future use of natural resources. The human appropriation of net primary production (HANPP) provides a useful measure of human intervention into the biosphere. The productive capacity of land is appropriated by harvesting or burning biomass and by converting natural ecosystems to managed lands with lower productivity. This work analyzes trends in HANPP from 1910 to 2005 and finds that although human population has grown fourfold and economic output 17-fold, global HANPP has only doubled. Despite this increase in efficiency, HANPP has still risen from 6.9 Gt of carbon per y in 1910 to 14.8 GtC/y in 2005, i.e., from 13% to 25% of the net primary production of potential vegetation. Biomass harvested per capita and year has slightly declined despite growth in consumption because of a decline in reliance on bioenergy and higher conversion efficiencies of primary biomass to products. The rise in efficiency is overwhelmingly due to increased crop yields, albeit frequently associated with substantial ecological costs, such as fossil energy inputs, soil degradation, and biodiversity loss. If humans can maintain the past trend lines in efficiency gains, we estimate that HANPP might only grow to 27-29% by 2050, but providing large amounts of bioenergy could increase global HANPP to 44%. This result calls for caution in refocusing the energy economy on land-based resources and for strategies that foster the continuation of increases in land-use efficiency without excessively increasing ecological costs of intensification.
Keywords: agriculture; food; global carbon cycle; land use intensity; resource use.
Conflict of interest statement
The authors declare no conflict of interest.
Figures


References
-
- Steffen W, Crutzen J, McNeill JR. The Anthropocene: Are humans now overwhelming the great forces of Nature? Ambio. 2007;36(8):614–621. - PubMed
-
- Ellis EC. Anthropogenic transformation of the terrestrial biosphere. Philos Trans A Math Phys Eng Sci. 2011;369(1938):1010–1035. - PubMed
-
- Andreae MO, McManus L, Matson PA. 2004. in Earth System Analysis for Sustainability, eds Schellnhuber H-J, Crutzen PJ, Clark WC, Claussen M, Held H (MIT Press, Cambridge, MA), pp 245–264.
-
- Foley JA, et al. Global consequences of land use. Science. 2005;309(5734):570–574. - PubMed
-
- Erb K-H, et al. A comprehensive global 5min resolution land-use dataset for the year 2000 consistent with national census data. J Land Use Sci. 2007;2(3):191–224.
Publication types
MeSH terms
Grants and funding
LinkOut - more resources
Full Text Sources
Other Literature Sources
Miscellaneous
