. 2013 May 21:19:1060-73.
Print 2013.

Prolonged light exposure induces widespread phase shifting in the circadian clock and visual pigment gene expression of the Arvicanthis ansorgei retina

Affiliations

Prolonged light exposure induces widespread phase shifting in the circadian clock and visual pigment gene expression of the Arvicanthis ansorgei retina

Corina Bobu et al. Mol Vis. .

Abstract

Purpose: Prolonged periods of constant lighting are known to perturb circadian clock function at the molecular, physiological, and behavioral levels. However, the effects of ambient lighting regimes on clock gene expression and clock outputs in retinal photoreceptors--rods, cones and intrinsically photosensitive retinal ganglion cells--are only poorly understood.

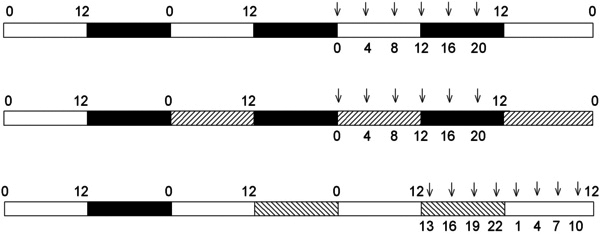
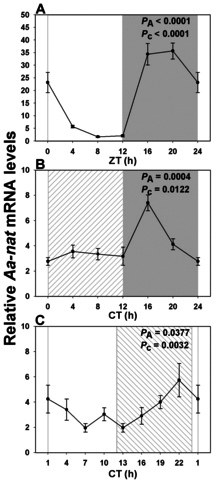
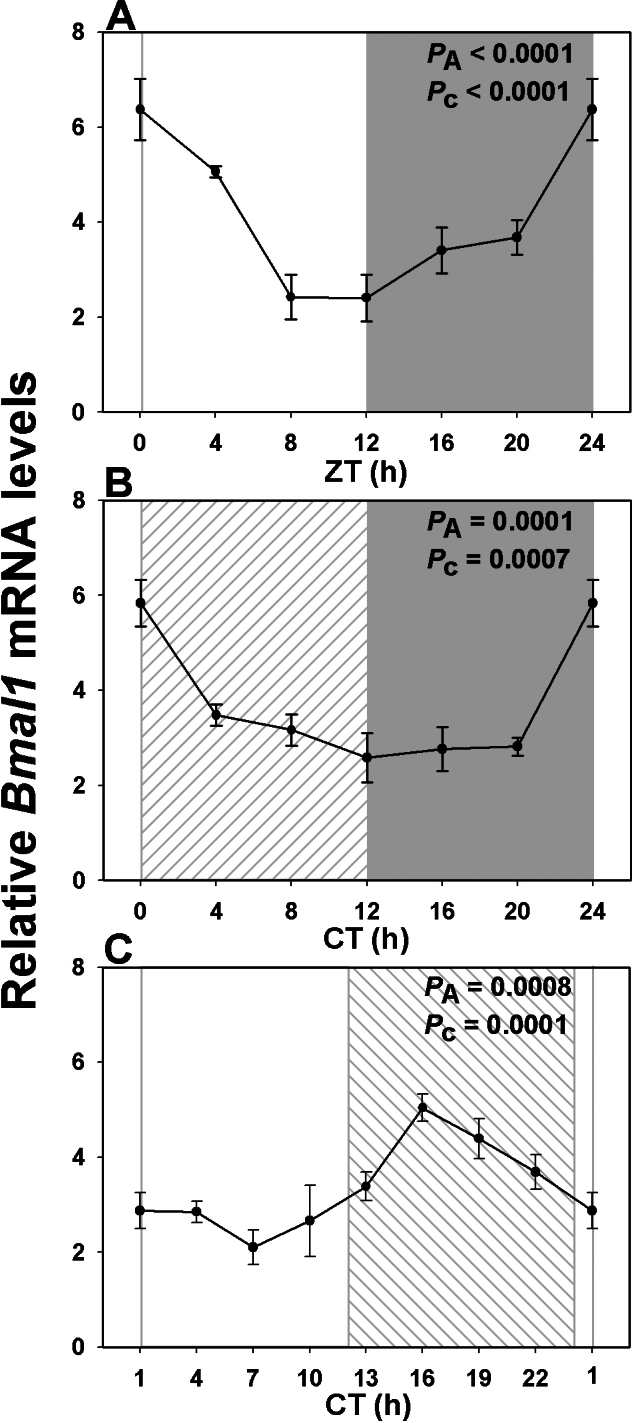
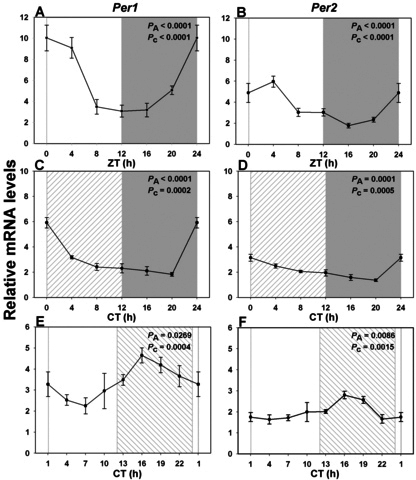
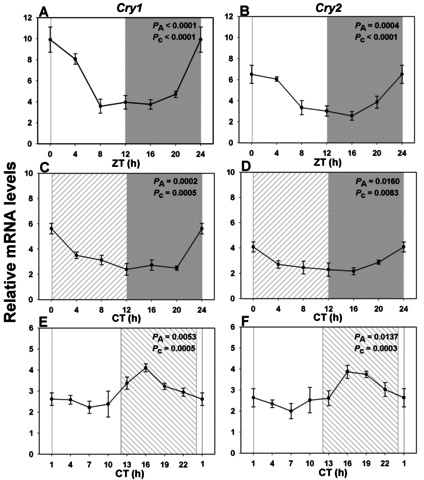
Methods: Cone-rich diurnal rodents (Muridae: Arvicanthis ansorgei) were maintained under and entrained to a 12 h:12 h light-dark cycle (LD; light: ~300 lux). Three groups were then examined: control (continued maintenance on LD); animals exposed to a 36 h dark period before sampling over an additional 24 h period of darkness (DD); and animals exposed to a 36 h light period before sampling over an additional 24 h period of light (~300 lux, LL). Animals were killed every 3 or 4 h over 24 h, their retinas dissected, and RNA extracted. Oligonucleotide primers were designed for the Arvicanthis clock genes Per1, Per2, Cry1, Cry2, and Bmal1, and for transcripts specific for rods (rhodopsin), cones (short- and mid-wavelength sensitive cone opsin, cone arrestin, arylalkylamine N-acetyltransferase) and intrinsically photosensitive retinal ganglion cells (melanopsin). Gene expression was analyzed by real-time PCR.

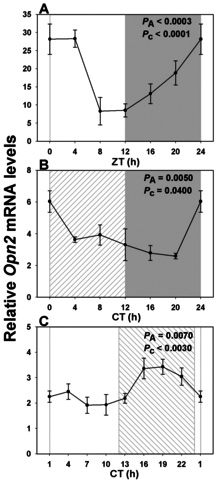
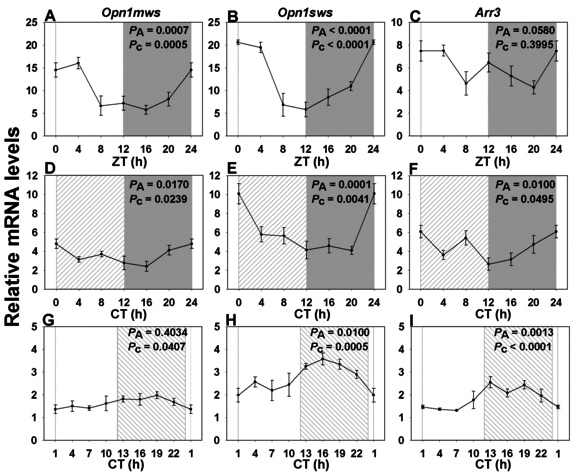
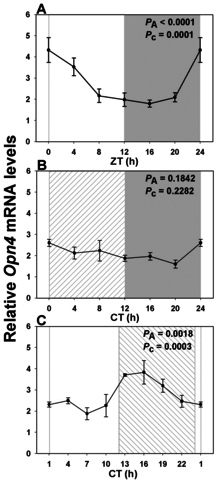
Results: In LD, expression of all genes except cone arrestin was rhythmic and coordinated, with acrophases of most genes at or shortly following the time of lights on (defined as zeitgeber time 0). Arylalkylamine N-acetyltransferase showed maximal expression at zeitgeber time 20. In DD conditions the respective profiles showed similar phase profiles, but were mostly attenuated in amplitude, or in the case of melanopsin, did not retain rhythmic expression. In LL, however, the expression profiles of all clock genes and most putative output genes were greatly altered, with either abolition of daily variation (mid-wavelength cone opsin) or peak expression shifted by 4-10 h.

Conclusions: These data are the first to provide detailed measures of retinal clock gene and putative clock output gene expression in a diurnal mammal, and show the highly disruptive effects of inappropriate (nocturnal) lighting on circadian and photoreceptor gene regulation.


Figures

Figure 1
Figure 1
Schematic diagram showing time schedule of experiments and sampling points. The bars show the paradigms used in light and dark (LD) conditions (alternating white [light, 300 lux, 12 h] and black [dark, 12 h] bars]; DD (alternating right hatched [subjective day] and black [subjective night] bars); and LL (alternating white [subjective day] and left hatched [subjective night] bars]. Arrows indicate time points at which animals were killed and examined.
Figure 2
Figure 2
Expression profile of rod-specific rhodopsin transcript over a single 24 h period under distinct lighting conditions. A: In a 12 h light: 12 h dark cycle (LD) a rhythmic pattern was observed with maximal expression close to “dawn” (night/day transition), and a nadir 12 h later (n=3–6 per time point). B: Rhodopsin expression profile was similar in constant dark (DD; n=6 per time point). C: In constant light (LL) there was a large phase shift, such that peak values now occurred during the subjective night (CT19; n=4 per time point). Illumination conditions are depicted as solid white (day) and solid gray (night) areas in LD, right hatched (subjective day) and solid gray (subjective night) areas in DD, and solid white (subjective day) and left hatched (subjective night) areas in constant light LL. Animals were killed every 3 or 4 h over a 24 h period, and RNA extracted from retinal tissue. RNA expression levels were quantified by real-time PCR. One-way analysis of variance (ANOVA) and cosinor levels of significance (PA and Pc respectively) are given in the upper right corner of each panel.
Figure 3
Figure 3
Expression profile of cone vision-related genes over a single 24 h period under distinct lighting conditions. A, D, G: RNA expression levels of Opn1mws in a 12 h light: 12 h dark cycle (LD), in constant dark (DD) and in constant light (LL). B, E, H: RNA expression levels of Opn1sws in LD, DD and LL. C, F, I: RNA expression levels of Arr3 in LD, DD and LL. In LD (n=3–6 per time point) both Opn1mws and Opn1sws transcripts showed rhythmic patterns with maximal expression at or closely following the night/day transition, and a nadir 12 h later (A, B). Arr3 expression did not fit a cosinor function (C). The shapes of the curves were mostly similar under DD (D: Opn1mws, E: Opn1sws, F: Arr3; n=6 per time point). However, LL conditions led to large phase shifts, with maxima in the early to middle night (G: Opn1mws, H: Opn1sws, I: Arr3; n=4 per time point). Illumination conditions are depicted as solid white (day) and solid grey (night) areas in LD, right hatched (subjective day) and solid grey (subjective night) areas in constant dark (DD) and solid white (subjective day) and left hatched (subjective night) areas in constant light (LL). Animals were killed every 3 or 4 h over a 24 h period, and RNA extracted from retinal tissue. RNA expression levels were quantified by real-time PCR. One-way analysis of variance (ANOVA) and cosinor levels of significance (PA and Pc respectively) are given in the upper right corner of each panel.
Figure 4
Figure 4
Expression profile of intrinsically photosensitive retinal ganglion cell-specific melanopsin transcript over a single 24 h period under distinct lighting conditions. A: In a 12 h light: 12 h dark cycle (LD) there was a rhythmic pattern with maximal expression close to “dawn” (night/day transition), and a nadir 12 h later (n=3–6 per time point). B: Melanopsin expression profile was attenuated in constant dark (DD) and did not attain significance (n=6 per time point). C: However, in constant light (LL) there was again a large phase shift, such that peak values now occurred in early night (CT15; n=4 per time point). Illumination conditions are depicted as solid white (day) and solid grey (night) areas in LD, right hatched (subjective day) and solid grey (subjective night) areas in constant dark (DD) and solid white (subjective day) and left hatched (subjective night) areas in constant light (LL). Animals were killed every 3 or 4 h across the 24 h period, and RNA extracted from retinal tissue. RNA expression levels were quantified by real time PCR. One-way analysis of variance (ANOVA) and cosinor levels of significance (PA and Pc respectively) are given in the upper right corner of each panel.
Figure 5
Figure 5
Expression profile of Aanat messenger RNA over a single 24 h period under distinct lighting conditions. A: In a 12 h light: 12h dark cycle (LD) there was a strongly rhythmic pattern with maximal expression at ZT20, and a nadir 12 h later (n=3-6 per time point). B: In constant dark (DD) the profile was attenuated, with a peak at CT16 (n=5-6 per time point). C: In constant light (LL) there was only a small phase shift, such that peak values were at CT22 (n=4 per time point). Illumination conditions are depicted as solid white (day) and solid grey (night) areas in LD, right hatched (subjective day) and solid grey (subjective night) areas in constant dark (DD) and solid white (subjective day) and left hatched (subjective night) areas in constant light (LL). Animals were killed every 3 or 4 h across the 24 h period, and RNA extracted from retinal tissue. RNA expression levels were quantified by real time PCR. One-way analysis of variance (ANOVA) and cosinor levels of significance (PA and Pc respectively) are given in the upper right corner of each panel.
Figure 6
Figure 6
Expression profile of core clock gene Bmal1 over a single 24 h period under distinct lighting conditions. A: In a 12 h light: 12 h dark cycle (LD) Bmal1 exhibited a rhythmic expression pattern with the peak value shortly after light onset (n=3-6 per time point). B: Rhythmicity was maintained although dampened in constant dark (DD) (n=6 per time point). C: However constant light (LL), as with the other genes, led to a large phase shift, with maximal values now occurring at CT18 (n=4 per time point). Illumination conditions are depicted as solid white (day) and solid grey (night) areas in LD, right hatched (subjective day) and solid grey (subjective night) areas in constant dark (DD) and solid white (subjective day) and left hatched (subjective night) areas in constant light (LL). Animals were killed every 3 or 4 h across the 24 h period, and RNA extracted from retinal tissue. RNA expression levels were quantified by real time PCR. One-way analysis of variance (ANOVA) and cosinor levels of significance (PA and Pc respectively) are given in the upper right corner of each panel.
Figure 7
Figure 7
Expression profile of the negative feedback loop Per transcripts over a single 24 h period under distinct lighting conditions. A, C, E: RNA expression levels of Per1 in a 12h light: 12 h dark cycle (LD), in constant dark (DD) and in constant light (LL). B, D, F: RNA expression levels of Per2 in LD, DD, and LL. Each gene showed a rhythmic pattern with maximal expression at or closely following night/day transition in LD (n=3-6 per time point) and DD (n=6 per time point; A, C: Per1, B, D: Per2). LL conditions led to large phase shifts, with maxima in the early to middle night (E: Per1, F: Per2; n=4 per time point). Illumination conditions are depicted as solid white (day) and solid grey (night) areas in LD, right hatched (subjective day) and solid grey (subjective night) areas in constant dark (DD) and solid white (subjective day) and left hatched (subjective night) areas in constant light (LL). Animals were killed every 3 or 4 h across the 24 h period, and RNA extracted from retinal tissue. RNA expression levels were quantified by real time PCR. One-way analysis of variance (ANOVA) and cosinor levels of significance (PA and Pc respectively) are given in the upper right corner of each panel.
Figure 8
Figure 8
Expression profile of the negative feedback loop Cry transcripts over a single 24 h period under distinct lighting conditions. A, C, E: RNA expression levels of Cry1 in a 12 h light: 12 h dark cycle (LD), in constant dark (DD) and in constant light (LL). B, D, F: RNA expression levels of Cry2 in LD, DD, and LL. Each gene showed a rhythmic pattern with maximal expression at or closely following night/day transition in LD (n=3-6 per time point) and DD (n=6 per time point; A, C: Cry1, B, D: Cry2). LL conditions led to large phase shifts, with maxima in the early to middle night (E: Cry1, F: Cry2; n=4 per time point). Illumination conditions are depicted as solid white (day) and solid grey (night) areas in LD, right hatched (subjective day) and solid grey (subjective night) areas in constant dark (DD) and solid white (subjective day) and left hatched (subjective night) areas in constant light (LL). Animals were killed every 3 or 4 h across the 24 h period, and RNA extracted from retinal tissue. RNA expression levels were quantified by real time PCR. One-way analysis of variance (ANOVA) and cosinor levels of significance (PA and Pc respectively) are given in the upper right corner of each panel.

References

    1. Cermakian N, Sassone-Corsi P. Environmental stimulus perception and control of circadian clocks. Curr Opin Neurobiol. 2002;12:359–65. - PubMed
    1. Tosini G. Melatonin circadian rhythm in the retina of mammals. Chronobiol Int. 2000;17:599–612. - PubMed
    1. Bassi CJ, Powers MK. Circadian rhythm in goldfish visual sensitivity. Invest Ophthalmol Vis Sci. 1987;28:1811–5. - PubMed
    1. Ko GY, Ko ML, Dryer SE. Circadian regulation of cGMP-gated cationic channels of chick retinal cones. Erk MAP Kinase and Ca2+/calmodulin-dependent protein kinase II. Neuron. 2001;29:255–66. - PubMed
    1. von Schantz M, Lucas RJ, Foster RG. Circadian oscillation of photopigment transcript levels in the mouse retina. Brain Res Mol Brain Res. 1999;72:108–14. - PubMed

Publication types

MeSH terms

LinkOut - more resources