. 2013 May 21:6:11.
doi: 10.3389/fnmol.2013.00011. eCollection 2013.

Transgenic mouse lines for non-invasive ratiometric monitoring of intracellular chloride

Affiliations

Transgenic mouse lines for non-invasive ratiometric monitoring of intracellular chloride

Laura Batti et al. Front Mol Neurosci. .

Abstract

Chloride is the most abundant physiological anion and participates in a variety of cellular processes including trans-epithelial transport, cell volume regulation, and regulation of electrical excitability. The development of tools to monitor intracellular chloride concentration ([Cli]) is therefore important for the evaluation of cellular function in normal and pathological conditions. Recently, several Cl-sensitive genetically encoded probes have been described which allow for non-invasive monitoring of [Cli]. Here we describe two mouse lines expressing a CFP-YFP-based Cl probe called Cl-Sensor. First, we generated transgenic mice expressing Cl-Sensor under the control of the mouse Thy1 mini promoter. Cl-Sensor exhibited good expression from postnatal day two (P2) in neurons of the hippocampus and cortex, and its level increased strongly during development. Using simultaneous whole-cell monitoring of ionic currents and Cl-dependent fluorescence, we determined that the apparent EC 50 for Cli was 46 mM, indicating that this line is appropriate for measuring neuronal [Cli] in postnatal mice. We also describe a transgenic mouse reporter line for Cre-dependent conditional expression of Cl-Sensor, which was targeted to the Rosa26 locus and by incorporating a strong exogenous promoter induced robust expression upon Cre-mediated recombination. We demonstrate high levels of tissue-specific expression in two different Cre-driver lines targeting cells of the myeloid lineage and peripheral sensory neurons. Using these mice the apparent EC 50 for Cli was estimated to be 61 and 54 mM in macrophages and DRG, respectively. Our data suggest that these mouse lines will be useful models for ratiometric monitoring of Cli in specific cell types in vivo.

Keywords: brain slices; dorsal root ganglia; fluorescent biosensors; intracellular chloride; macrophages; non-invasive monitoring; optogenetics.


Figures

Figure 1
Figure 1
Expression of Cl-Sensor in Thy1::Cl-sensor transgenic mice. (A) The Thy1::Cl-Sensor construct was constructed by fusing a fragment containing minimal regulatory elements and the promoter of the Thy1 gene upstream to the coding sequence of the Cl-Sensor followed by a SV40 polyadenylation signal. (B and C) Representative z-stack projection images of the CA1 region of the hippocampus in a Thy1::Cl-Sensor transgenic mouse showing CFP (upper left), YFP (upper right), and DAPI (lower left), and merged (lower right) fluorescence at (B) 20× magnification, scale bar corresponds to 30 μm and (C) 40× magnification, scale bar corresponds to 100 μm. Cl-Sensor expression was found in a mosaic pattern in most, but not all CA1 pyramidal neurons.
Figure 2
Figure 2
Developmental profile of Cl-Sensor expression in hippocampus and cortex in Thy1::Cl-Sensor transgenic mice. Mean values of fluorescence induced by excitation of neurons from brain slices in hippocampus (left) and cortex (right) at different ages (shown below columns). An excitation wavelength of 440 nm for a duration of 20 ms was used with a ×60 objective. Bars are mean ± SEM values. Number of analyzed cells for each age is shown in columns.
Figure 3
Figure 3
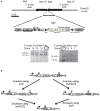
Generation of Cl-Sensor transgenic mouse. (A) The Cl-Sensor cassettes were assembled and inserted into the XbaI site of the ROSA26 targeting vector. Southern blot was used to confirm proper homologous recombination on ES cell selected clones. Clone number 17 was selected for blastocyst injection. (B) Schematic representation of the Rosa26 locus after targeted introduction of the neomycin-Cl-Sensor cassette. The Cl-Sensor cassette, including an SV40 polyadenylation site, is inserted in an antisense orientation. Two alternative recombination intermediates are generated by Cre-mediated inversion at the wild-type loxP sites (filled triangles), and mutant loxP2272 sites (open triangles).
Figure 4
Figure 4
Calibration of Cl-Sensor in brain slices of Thy1 mice. (A) Image of cells expressing Cl-Sensor in a hippocampal slice from P4 aged Thy1::Cl-Sensor mouse, excitation 480 nm. (B) Micrographs of cells expressing Cl-Sensor in cortical slice from Thy1 mouse at age P15; top, light illumination; Note the shadow of the recording pipette; bottom, excitation 480 nm. (C) Relative changes in RCl (F440/F480) from simultaneous whole-cell recordings with different concentration of Cl in the recording pipette: 4 mM (black trace), 60 mM (blue trace), and 135 mM (red trace). RCl0 corresponds to [Cl]i in cell attached mode. Time = 0 corresponds to the moment of membrane rupture into whole-cell mode. Note the further increase in RCl at depolarization from 𢈒80 to 0 mV in the cells recorded with 60 mM (blue trace) and 135 mM (red trace) Cl in the pipette. (D) Calibration curve for Cl-Sensor expressed in neurons of brain slices from Thy1 mice obtained by recording at five different Cl concentrations: 4, 10, 20, 60, and 135 mM. EC50 = 46.4 ± 2.2 mM (mean ± S.E.M.). Data from 5 to 7 cells for each Cl concentration are presented.
Figure 5
Figure 5
Monitoring [Cl]i in neurons from cortical brain slices. (A) Images of cells in a cortical slice from a P22 mouse expressing Cl-Sensor in visible light (top) and excitation 480 nm (bottom). (B) Example of changes in RCl (F440/F480) after membrane depolarization from a holding potential of −80 to +30 mV in the neuron from a cortical slice (P15) recorded with pipette solution containing 135 mM Cl (red trace—whole-cell, blue trace—intact cell). Note that depolarization of the cell recorded with high Cl caused an additional increase in the RCl. (C) Monitoring of epileptic-like seizures in neurons of brain slice from cortex (P22). Traces of RCl changes from two neurons are illustrated upon application of 100 μM 4-AP. The neuron corresponding to the red trace was patched with a pipette containing 135 mM Cl, while the blue trace corresponds to the record from intact neurons. Note that 4-AP application caused a stronger increase in RCl than depolarization from 𢈒70 to +30 mV.
Figure 6
Figure 6
[Cl]i calibration and measurement in DRG cultures. (A) Image examples of permeabilized DRG cultures from Avil-Cre::Cl-Sensor at 10 mM (top) or 50 mM (bottom) chloride concentration. From left to right: image captured with the 440 nm laser (blue), 514 nm laser (yellow), merged, bright field images and 440/514 images. Scale bars correspond to 20 μm (B) [Cl]i Calibration curve for Cl-Sensor on DRG cultures from Avil-Cre::Cl-Sensor. 440/514 values were calculated at 0, 10, 20, 30, 50, 100, and 150 mM [Cl]i (n = 55). (C) Examples of [Cl]i measurement in DRG culture under basal conditions. From left to right: image captured with the 440 nm laser (blue), 514 nm laser (yellow), merged, bright field images and 440/514 images. Scale bar corresponds to 20 μm (D) The relationship between cell size and [Cl]i in DRG neurons n = 260.
Figure 7
Figure 7
[Cl]i measurement on whole-mount DRG from Avil-Cre::Cl-Sensor mice. (A) An xy-plane projection of a deconvolved 75 μm stack of an isolated whole-mount DRG. Tissue was excited with a 440 nm laser and CFP (blue) was detected. Scale bar corresponds to 200 μm. (B) Example of a DRG image under basal conditions used for [Cl]i measurement. From left to right: image captured with the 440 nm laser (blue), 514 nm laser (yellow), and 440/514 images. Scale bars correspond to 20 μm. (C) The relationship between cell size and [Cl]i in DRG neurons from a whole mount preparation n = 39.
Figure 8
Figure 8
[Cl]i calibration and measurement in peritoneal macrophages from LysM-Cre::Cl-Sensor mice. (A) Representative images of permeabilized peritoneal macrophages cultures which were subjected to β-escin treatment followed by the addition of 0 mM (top) or 150 mM (bottom) extracellular Cl solutions. From left to right: image captured with the 440 nm laser (blue), 514 nm laser (yellow), merged and 440/514 images. Scale bars correspond to 20 μm. (B) [Cl]i calibration curve on peritoneal macrophages cultures. 440/514 values were calculated at 0, 10, 20, 30, 50, 100, and 150 mM [Cl]i (n = 225). (C) Images of basal [Cl]i in macrophages. (D) Histogram of [Cl]i distribution in macrophages (n = 181). The distribution of [Cl]i was fit with a Gaussian curve to give a mean of 65.48 ± 1.07 mM. Scale bars correspond to 20 μm.

References

    1. Aigner L., Arber S., Kapfhammer J. P., Laux T., Schneider C., Botteri F., et al. (1995). Overexpression of the neural growth-associated protein GAP-43 induces nerve sprouting in the adult nervous system of transgenic mice. Cell 83, 269–278 10.1016/0092-8674(95)90168-X - DOI - PubMed
    1. Alvarez-Leefmans F. J., Gamino S. M., Giraldez F., Nogueron I. (1988). Intracellular chloride regulation in amphibian dorsal root ganglion neurones studied with ion-selective microelectrodes. J. Physiol. 406, 225–246 - PMC - PubMed
    1. Arenkiel B. R., Peca J., Davison I. G., Feliciano C., Deisseroth K., Augustine G. J., et al. (2007). In vivo light-induced activation of neural circuitry in transgenic mice expressing channelrhodopsin-2. Neuron 54, 205–218 10.1016/j.neuron.2007.03.005 - DOI - PMC - PubMed
    1. Arosio D., Ricci F., Marchetti L., Gualdani R., Albertazzi L., Beltram F. (2010). Simultaneous intracellular chloride and pH measurements using a GFP-based sensor. Nat. Methods 7, 516–518 10.1038/nmeth.1471 - DOI - PubMed
    1. Avoli M., Barbarosie M., Lucke A., Nagao T., Lopantsev V., Kohling R. (1996). Synchronous GABA-mediated potentials and epileptiform discharges in the rat limbic system in vitro. J. Neurosci. 16, 3912–3924 - PMC - PubMed

LinkOut - more resources