

Associations of suboptimal growth with all-cause and cause-specific mortality in children under five years: a pooled analysis of ten prospective studies
- PMID: 23734210
- PMCID: PMC3667136
- DOI: 10.1371/journal.pone.0064636
Associations of suboptimal growth with all-cause and cause-specific mortality in children under five years: a pooled analysis of ten prospective studies
Abstract
Background: Child undernutrition affects millions of children globally. We investigated associations between suboptimal growth and mortality by pooling large studies.
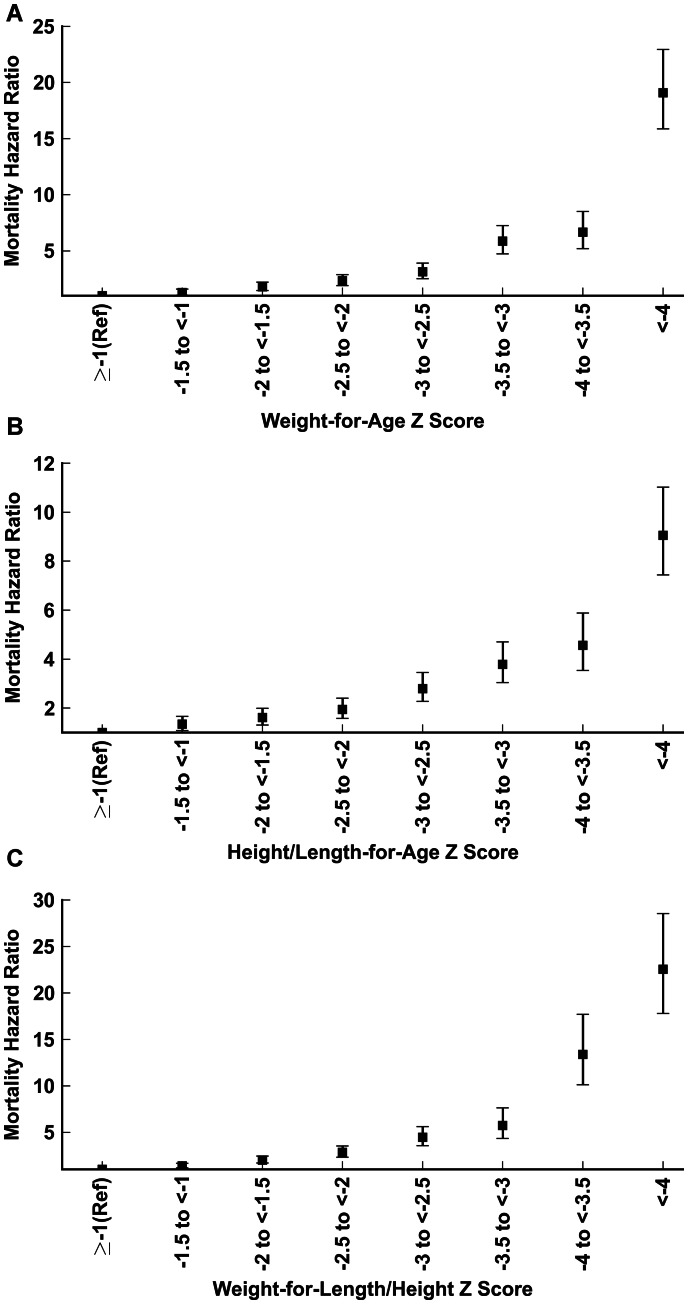
Methods: Pooled analysis involving children 1 week to 59 months old in 10 prospective studies in Africa, Asia and South America. Utilizing most recent measurements, we calculated weight-for-age, height/length-for-age and weight-for-height/length Z scores, applying 2006 WHO Standards and the 1977 NCHS/WHO Reference. We estimated all-cause and cause-specific mortality hazard ratios (HR) using proportional hazards models comparing children with mild (-2≤Z<-1), moderate (-3≤Z<-2), or severe (Z<-3) anthropometric deficits with the reference category (Z≥-1).
Results: 53 809 children were eligible for this re-analysis and contributed a total of 55 359 person-years, during which 1315 deaths were observed. All degrees of underweight, stunting and wasting were associated with significantly higher mortality. The strength of association increased monotonically as Z scores decreased. Pooled mortality HR was 1.52 (95% Confidence Interval 1.28, 1.81) for mild underweight; 2.63 (2.20, 3.14) for moderate underweight; and 9.40 (8.02, 11.03) for severe underweight. Wasting was a stronger determinant of mortality than stunting or underweight. Mortality HR for severe wasting was 11.63 (9.84, 13.76) compared with 5.48 (4.62, 6.50) for severe stunting. Using older NCHS standards resulted in larger HRs compared with WHO standards. In cause-specific analyses, all degrees of anthropometric deficits increased the hazards of dying from respiratory tract infections and diarrheal diseases. The study had insufficient power to precisely estimate effects of undernutrition on malaria mortality.
Conclusions: All degrees of anthropometric deficits are associated with increased risk of under-five mortality using the 2006 WHO Standards. Even mild deficits substantially increase mortality, especially from infectious diseases.
Conflict of interest statement
Figures
References
-
- Black RE, Allen LH, Bhutta ZA, Caulfield LE, de Onis M, et al. (2008) Maternal and child undernutrition: global and regional exposures and health consequences. Lancet 371(9608): 243–60. - PubMed
-
- Scrimshaw NS, SanGiovanni JP (1997) Synergism of nutrition, infection, and immunity: an overview. Am J Clin Nutr 66(2): 464S–77S. - PubMed
-
- UNICEF (1990) Strategy for improved nutrition of children and women in developing countries. New York: UNICEF. - PubMed
-
- Alam N, Wojtyniak B, Rahaman MM (1989) Anthropometric indicators and risk of death. Am J Clin Nutr 49(5): 884–8. - PubMed
Publication types
MeSH terms
Grants and funding
LinkOut - more resources
Full Text Sources
Other Literature Sources
Medical
