. 2013 Jun;25(6):2265-75.
doi: 10.1105/tpc.113.111567. Epub 2013 Jun 4.

A rapid ribosome profiling method elucidates chloroplast ribosome behavior in vivo

Affiliations

A rapid ribosome profiling method elucidates chloroplast ribosome behavior in vivo

Reimo Zoschke et al. Plant Cell. 2013 Jun.

Abstract

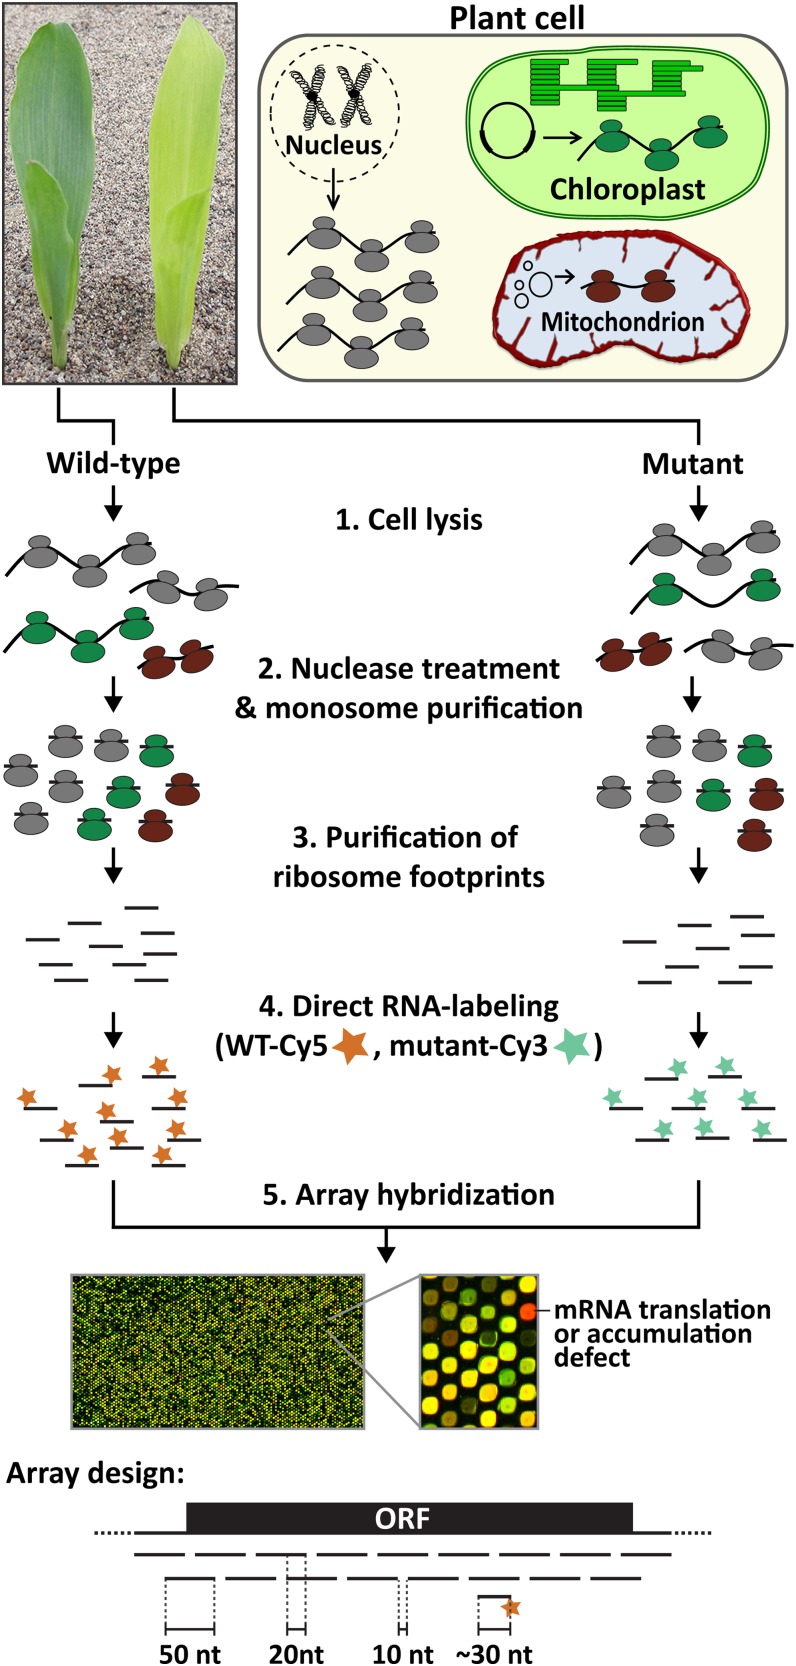
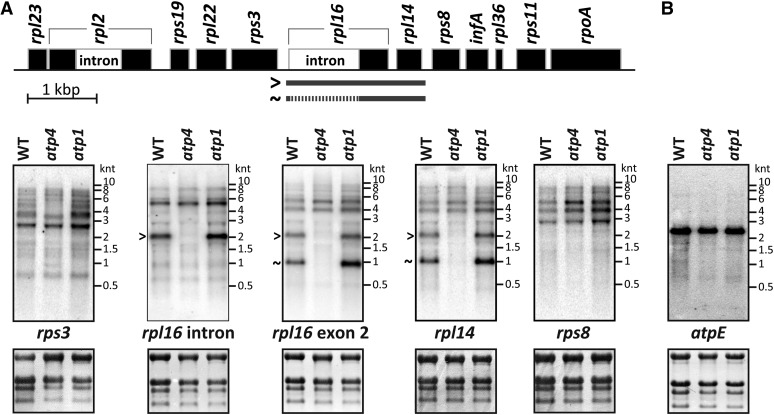
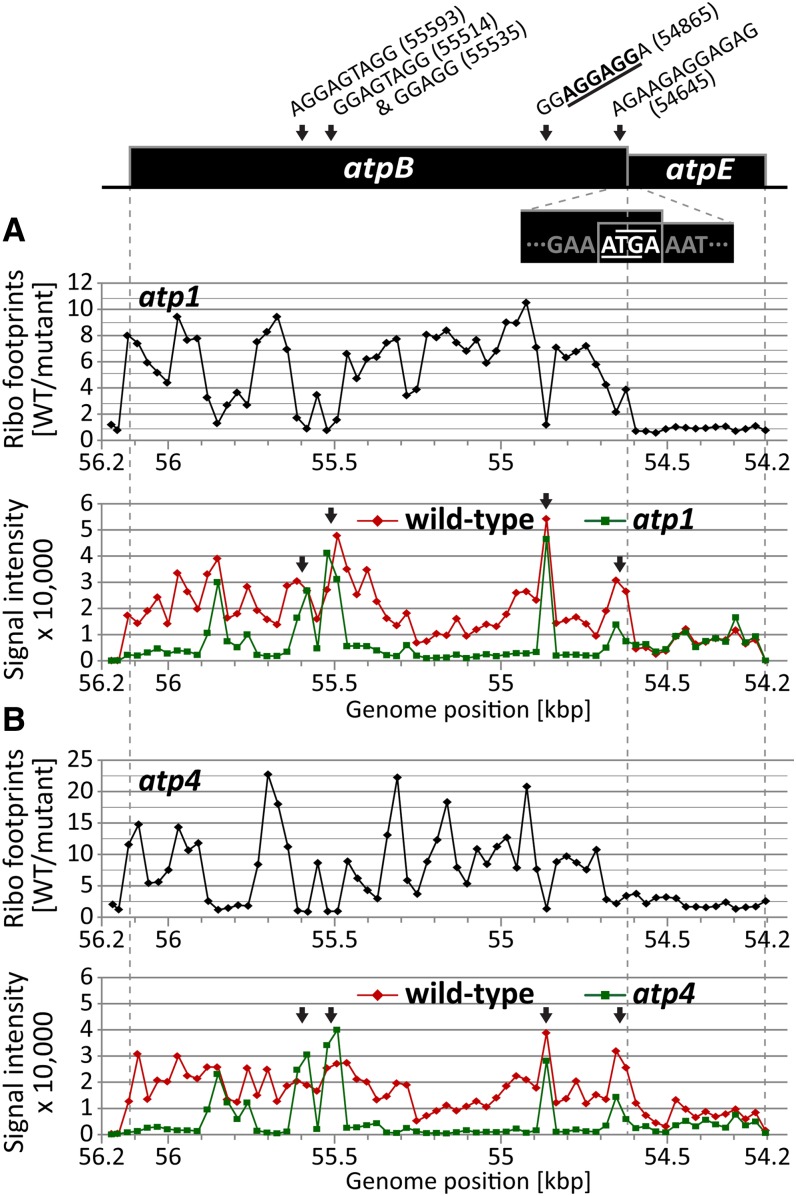
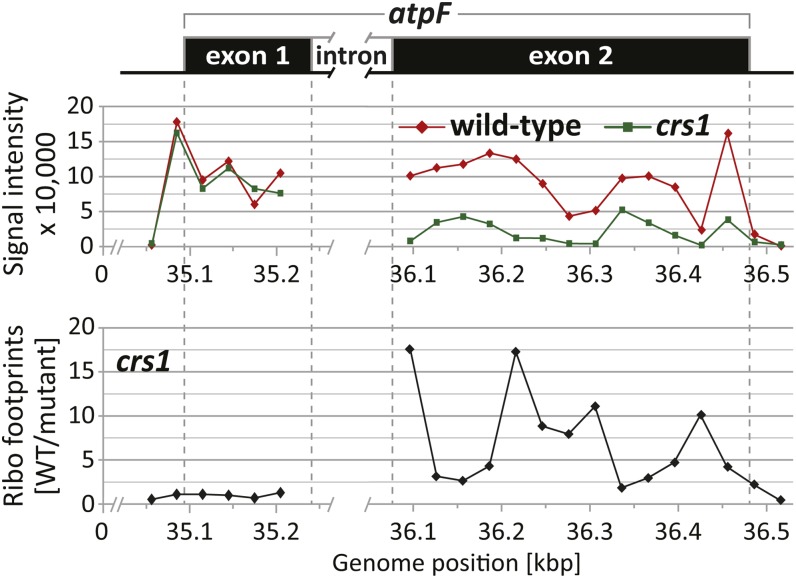
The profiling of ribosome footprints by deep sequencing has revolutionized the analysis of translation by mapping ribosomes with high resolution on a genome-wide scale. We present a variation on this approach that offers a rapid and cost-effective alternative for the genome-wide profiling of chloroplast ribosomes. Ribosome footprints from leaf tissue are hybridized to oligonucleotide tiling microarrays of the plastid ORFeome and report the abundance and translational status of every chloroplast mRNA. Each assay replaces several time-consuming traditional methods while also providing information that was previously inaccessible. To illustrate the utility of the approach, we show that it detects known defects in chloroplast gene expression in several nuclear mutants of maize (Zea mays) and that it reveals previously unsuspected defects. Furthermore, it provided firm answers to several lingering questions in chloroplast gene expression: (1) the overlapping atpB/atpE open reading frames, whose translation had been proposed to be coupled, are translated independently in vivo; (2) splicing is not a prerequisite for translation initiation on an intron-containing chloroplast RNA; and (3) a feedback control mechanism that links the synthesis of ATP synthase subunits in Chlamydomonas reinhardtii does not exist in maize. An analogous approach is likely to be useful for studies of mitochondrial gene expression.


Figures

Figure 1.
Figure 1.
Overview of the Microarray-Based Ribosome Profiling Approach and Its Application for Studying Mutants with Defects in Chloroplast Gene Expression. Steps 1 through 3 are similar to the sequencing-based ribosome profiling method (Ingolia et al., 2012). Subsequently, the ribosome footprints are directly labeled (step 4) and hybridized to tiling microarrays that probe all protein-coding regions of the chloroplast genome (step 5). A screen capture of data from an analysis of a ppr10 mutant is shown; the red spot maps in the atpH RNA, whose translation and stability are known to rely on PPR10 (Pfalz et al., 2009). The microarray design is diagrammed below: 50-mer oligonucleotides cover all known protein-coding regions (ORF), with adjacent probes overlapping by 20 nucleotides (nt). WT, the wild type.
Figure 2.
Figure 2.
Distribution of Ribosome Footprint Signals in the Chloroplast psbB Gene Cluster. A map of the psbB transcription unit in maize is shown at top. The predominant 5′ end upstream of psbB and 3′ end downstream of petD are marked (Zhelyazkova et al., 2012). Vertical dashed lines mark the positions of start codons, stop codons, and splice junctions. The normalized signals for the wild-type samples (F635) from the atp1 analysis are plotted according to genomic position. A full genome view is shown in Supplemental Figure 1D online. The signals within coding regions (gray shaded) are higher than those in transcribed but untranslated regions (unshaded). Intron sequences were not represented on the microarray. [See online article for color version of this figure.]
Figure 3.
Figure 3.
Microarray-Based Ribosome Profiling of Chloroplast mRNAs in atp1, atp4, ppr10, and crp1 Mutants. (A) Map of the maize chloroplast genome illustrating protein-coding genes only. The map was created with OGDraw (Lohse et al., 2007). The map shows just one of the two large inverted repeat regions. Asterisks and crosses mark genes with previously described and newly identified gene expression defects, respectively. Dashed lines connect genes on the map with peaks in the plots below. (B) and (C) Median ratios of ribosome footprint signals (Ribo footprints) in the wild type (WT) versus atp1 and atp4 mutants (F635/F532) are plotted as a function of genome position. Each plot shows normalized values obtained from two biological replicates. Peaks represent regions with fewer ribosome footprints in the mutants compared with the wild type. (D) and (E) Top panels: Median ratios of ribosome footprint signals in the wild type versus ppr10 or crp1 mutants (F635/F532) are plotted as in (B) and (C). Whole-genome views of the ppr10 and crp1 ribosome footprint data with reduced y axis scales are given in Supplemental Figures 1B and 1C online, respectively, to better visualize minor peaks. Middle panels: Median ratios of total RNA signals in the wild type versus ppr10 or crp1 mutants (F635/F532) are plotted as a function of genome position. Each plot shows normalized values obtained from one experiment. Peaks represent regions with RNA accumulation defects in the mutants. Bottom panels: Relative translation efficiencies were calculated as the ratios of ribosome footprint ratios (shown in the top panels) to total RNA ratios (shown in the middle panels). [See online article for color version of this figure.]
Figure 4.
Figure 4.
Slot-Blot Hybridization Assays Discriminate Translation and RNA Accumulation Defects in atp1, atp4, ppr10, and crs1 Mutants. Three hundred nanograms of ribosome footprint RNA and 300 ng of total RNA from plants of the indicated genotype were applied to nylon membranes and hybridized to radiolabeled DNA probes covering large segments of the indicated ORFs (probes are described in Methods). The ratio of footprint signal in the wild type (WT) versus mutant (blue bars) indicates the overall ratio of expression. The ratio of total RNA in the wild type versus mutant (red bars) reveals differences in RNA level. Translational efficiency in the wild type versus mutant is indicated by the ratio of ratios [wild-type footprint/mutant footprint]/[wild type total RNA/mutant total RNA] (green bars).
Figure 5.
Figure 5.
RNA Gel Blot Assays Confirm a Previously Unknown rpl14 Expression Defect Detected in Ribosome Profiles of atp4 Mutants. Total leaf RNA (4 µg/lane) was analyzed by RNA gel blot hybridizations using probes corresponding to the indicated chloroplast genes. The positions of RNA size markers are shown (kilonucleotides [knt]). rRNAs were detected on the same filters by staining with methylene blue and are shown below the autoradiograms. (A) Follow-up to atp4 ribosome profile data suggesting a defect in rpl14 expression (Figure 3C; see Supplemental Figure 2C online). Probes from the transcription unit harboring rpl14 (map at top) revealed the specific absence of spliced and unspliced dicistronic rpl16-rpl14 transcripts in atp4 mutants. The nonallelic atp1 mutant, which phenocopies the ATP synthase defect of atp4, does not show this RNA accumulation defect. (B) Hybridization with an atpE-specific probe confirms that the atpE ORF is solely found on a dicistronic atpB/atpE transcript in maize. WT, the wild type.
Figure 6.
Figure 6.
Ribosome Profiling Data Showing Uncoupled Translation of the Overlapping atpB/E ORFs and Suggesting Ribosome Pausing at Shine-Dalgarno–Like Sequences. A map of the atpB/E coding region in maize is shown at top, with the sequence at the overlap between the atpB stop codon (TGA, overlined) and atpE start codon (ATG, underlined) indicated. Vertical dashed lines mark the positions of start and stop codons. Peaks in the single-channel data that coincide with internal Shine-Dalgarno–like sequences are labeled by arrows (for details, see Results). The top diagrams show median ratios of ribosome footprint signals (Ribo footprints) in the wild type (WT) versus mutant (F635/F532) for the atpB/E coding region. The bottom diagrams show normalized ribosome footprint signals from wild-type or mutant samples in the atpB/E coding region. The full genome data are shown in Figures 3B and 3C and Supplemental Figures 1D and 1E online. (A) Ribosome footprint data for the overlapping atpB and atpE ORFs in the atp1 mutant. (B) Ribosome footprint data for the overlapping atpB and atpE ORFs in the atp4 mutant. [See online article for color version of this figure.]
Figure 7.
Figure 7.
Translation of Unspliced atpF mRNA Detected by Ribosome Profiling of the crs1 Mutant. A map of the atpF gene is shown at top. Vertical dashed lines mark the positions of the start codon, stop codon, and splice junctions. Intron sequences are marked by a gap in the map because they were not represented on the microarray. The top diagram shows the normalized ribosome footprint signals from wild-type (F635) or crs1 mutant (F532) samples in the atpF coding region. The bottom diagram shows median ratios of ribosome footprint signals in the wild type (WT) versus mutant (F635/F532) for the atpF coding region (the full genome data are shown in Supplemental Figures 1H and 2D online). [See online article for color version of this figure.]

Similar articles

Cited by

References

    1. Barkan A. (1989). Tissue-dependent plastid RNA splicing in maize: Transcripts from four plastid genes are predominantly unspliced in leaf meristems and roots. Plant Cell 1: 437–445 - PMC - PubMed
    1. Barkan A. (1998). Approaches to investigating nuclear genes that function in chloroplast biogenesis in land plants. Methods Enzymol. 297: 38–57
    1. Barkan A. (2011). Expression of plastid genes: Organelle-specific elaborations on a prokaryotic scaffold. Plant Physiol. 155: 1520–1532 - PMC - PubMed
    1. Barkan A., Walker M., Nolasco M., Johnson D. (1994). A nuclear mutation in maize blocks the processing and translation of several chloroplast mRNAs and provides evidence for the differential translation of alternative mRNA forms. EMBO J. 13: 3170–3181 - PMC - PubMed
    1. Brar G.A., Yassour M., Friedman N., Regev A., Ingolia N.T., Weissman J.S. (2012). High-resolution view of the yeast meiotic program revealed by ribosome profiling. Science 335: 552–557 - PMC - PubMed

Publication types

MeSH terms

Substances

Associated data

LinkOut - more resources