Meta-Analysis
. 2013 Jun;19(6):899-908.
doi: 10.3201/eid1906.120543.

Zoonotic Mycobacterium bovis-induced tuberculosis in humans

Affiliations
Meta-Analysis

Zoonotic Mycobacterium bovis-induced tuberculosis in humans

Borna Müller et al. Emerg Infect Dis. 2013 Jun.

Abstract

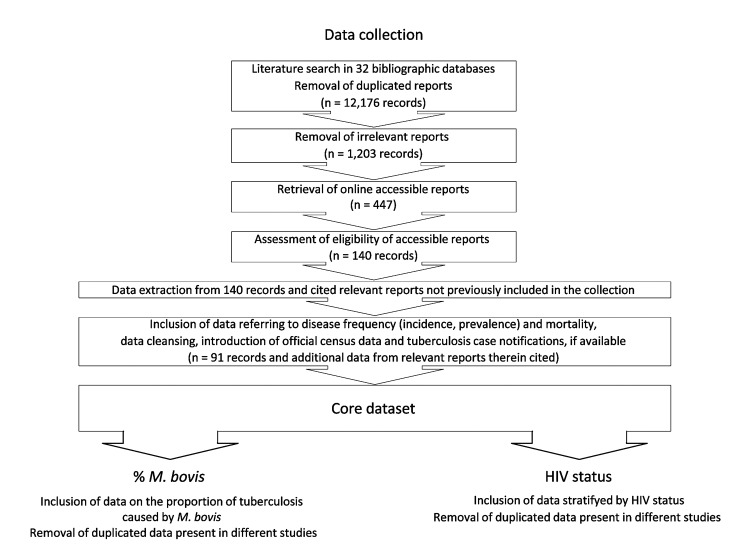
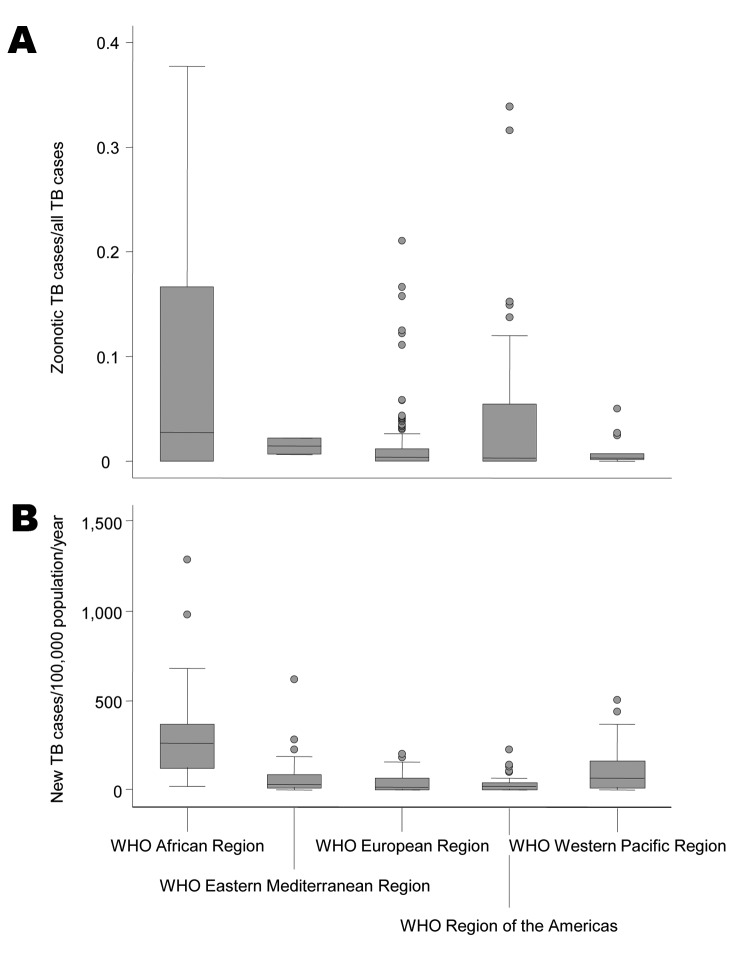
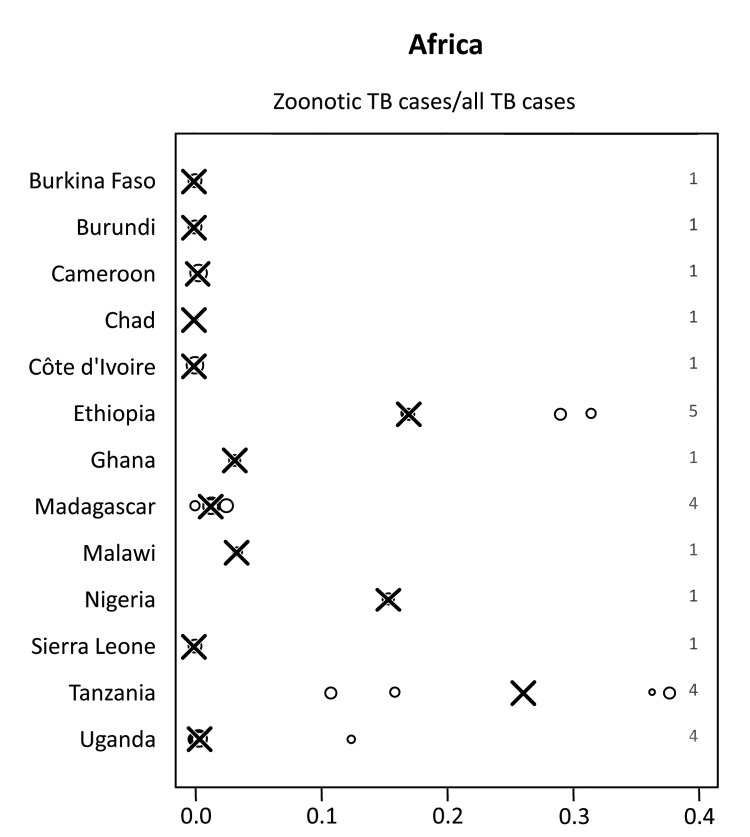
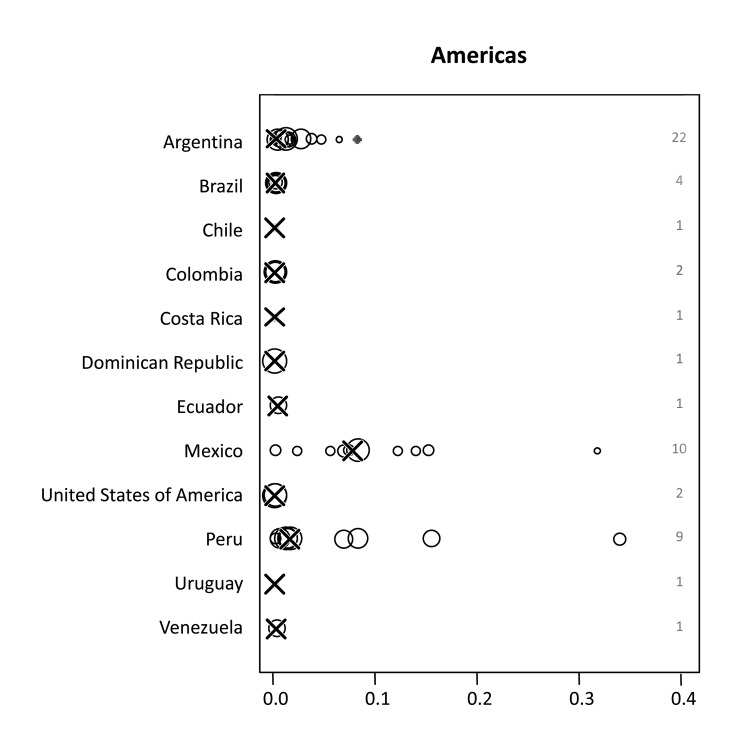
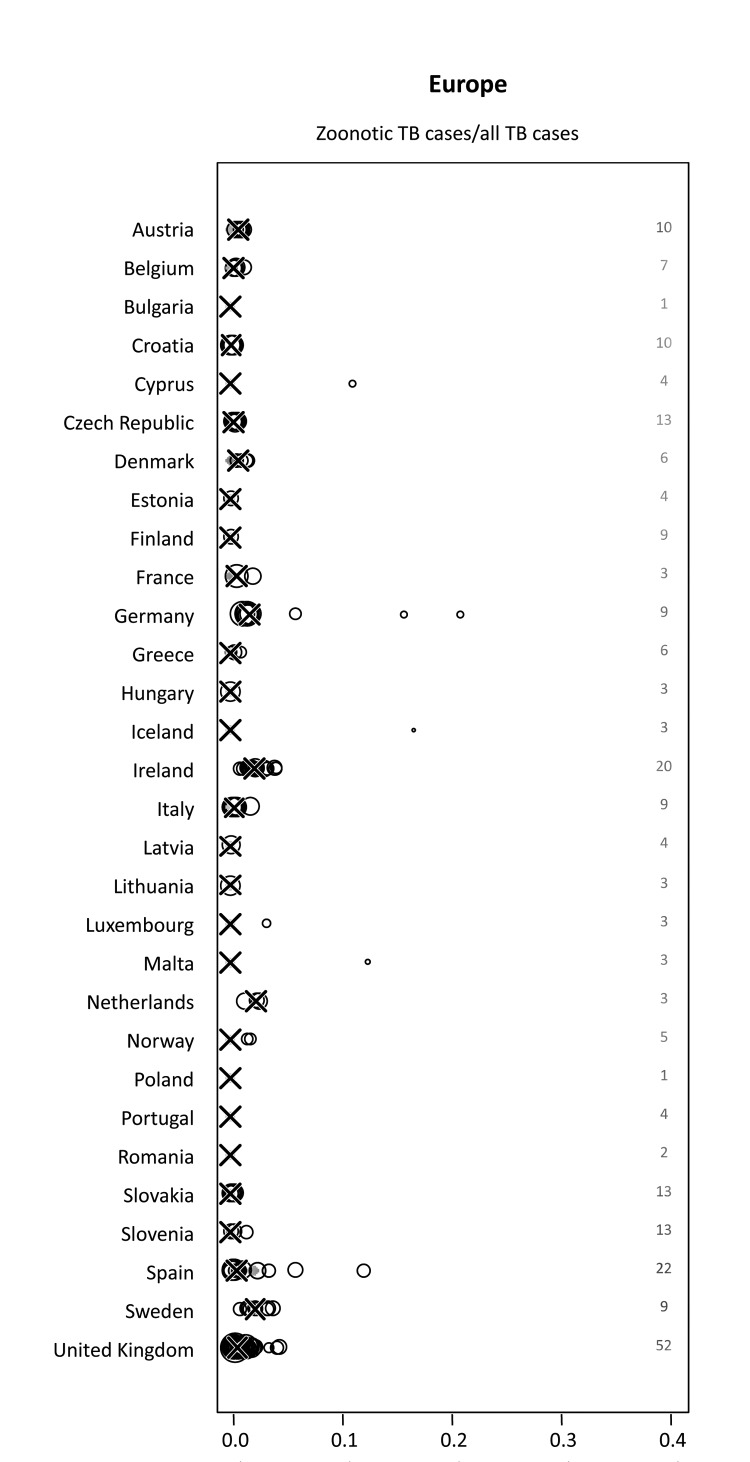
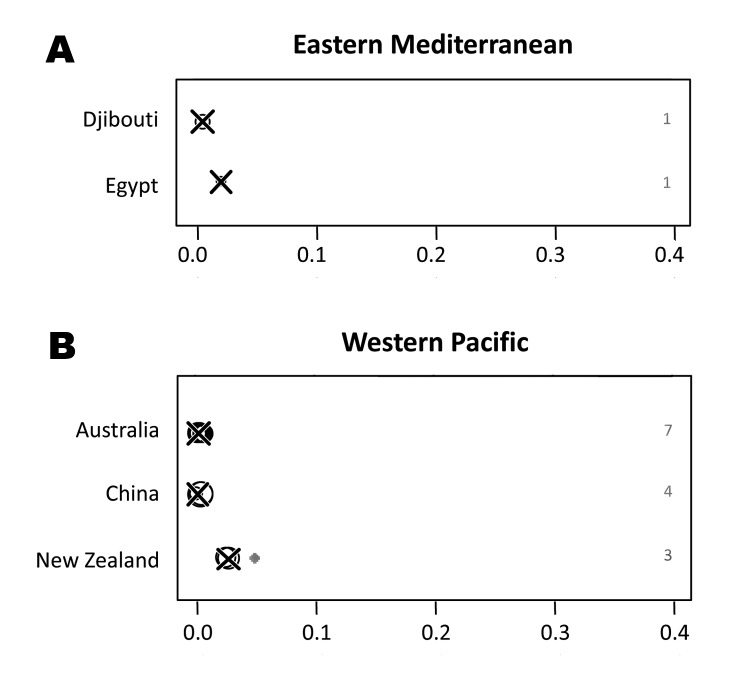
We aimed to estimate the global occurrence of zoonotic tuberculosis (TB) caused by Mycobacterium bovis or M. caprae infections in humans by performing a multilingual, systematic review and analysis of relevant scientific literature of the last 2 decades. Although information from many parts of the world was not available, data from 61 countries suggested a low global disease incidence. In regions outside Africa included in this study, overall median proportions of zoonotic TB of ≤1.4% in connection with overall TB incidence rates ≤71/100,000 population/year suggested low incidence rates. For countries of Africa included in the study, we multiplied the observed median proportion of zoonotic TB cases of 2.8% with the continental average overall TB incidence rate of 264/100,000 population/year, which resulted in a crude estimate of 7 zoonotic TB cases/100,000 population/year. These generally low incidence rates notwithstanding, available data indicated substantial consequences of this disease for some population groups and settings.

Keywords: Mycobacterium bovis; TB; bacteria; bovine tuberculosis; neglected tropical diseases; systematic review; tuberculosis and other mycobateria; zoonosis; zoonotic TB.


Figures

Figure 1
Figure 1
Selection procedure for reports included in this analysis. A list of all identified 1,203 potentially relevant reports and the core dataset is available as supplemental material (online Technical Appendix 2, wwwnc.cdc.gov/EID/article/19/6/12-0543-Techapp2.xlsx). TB, tuberculosis; M. bovis, Mycobacterium bovis.
Figure 2
Figure 2
Proportion of zoonotic tuberculosis (TB) among all TB cases (A) and estimated overall TB incidence (B) stratified by World Health Organization (WHO) region. Overall TB incidence rates estimated for 2010 by WHO regions covered all countries of the respective regions. Numbers were obtained from WHO (1).
Figure 3
Figure 3
Proportion of zoonotic tuberculosis (TB) among all TB cases stratified by country: Africa. x-axis values are median proportions. Each circle represents a study with the circle diameter being proportional to the log10 of the number of isolates tested. A gray rhombus indicates that the number of samples tested was not reported or could not be inferred from the data available. The median proportion of all studies for a given country is indicated by X. Numbers on the right side of the figures indicate the number of studies included for any given country.
Figure 4
Figure 4
Proportion of zoonotic tuberculosis (TB) among all TB cases stratified by country: Americas. x-axis values are median proportions. Each circle represents a study with the circle diameter being proportional to the log10 of the number of isolates tested. A gray rhombus indicates that the number of samples tested was not reported or could not be inferred from the data available. The median proportion of all studies for a given country is indicated by X. Numbers on the right side of the figures indicate the number of studies included for any given country.
Figure 5
Figure 5
Proportion of zoonotic tuberculosis (TB) among all TB cases stratified by country: Europe. x-axis values are median proportions. Each circle represents a study with the circle diameter being proportional to the log10 of the number of isolates tested. A gray rhombus indicates that the number of samples tested was not reported or could not be inferred from the data available. The median proportion of all studies for a given country is indicated by X. Numbers on the right side of the figures indicate the number of studies included for any given country.
Figure 6
Figure 6
Proportion of zoonotic tuberculosis (TB) among all TB cases stratified by country: A) Eastern Mediterranean; B) Western Pacific. x-axis values are median proportions. Each circle represents a study with the circle diameter being proportional to the log10 of the number of isolates tested. A gray rhombus indicates that the number of samples tested was not reported or could not be inferred from the data available. The median proportion of all studies for a given country is indicated by X. Numbers on the right side of the figures indicate the number of studies included for any given country.

References

    1. World Health Organization. Global tuberculosis control: WHO Report 2011. Geneva: The Organization; 2011.
    1. Cosivi O, Grange JM, Daborn CJ, Raviglione MC, Fujikura T, Cousins D, et al. Zoonotic tuberculosis due to Mycobacterium bovis in developing countries. Emerg Infect Dis. 1998;4:59–70. 10.3201/eid0401.980108 - DOI - PMC - PubMed
    1. Ayele WY, Neill SD, Zinsstag J, Weiss MG, Pavlik I. Bovine tuberculosis: an old disease but a new threat to Africa. Int J Tuberc Lung Dis. 2004;8:924–37 . - PubMed
    1. Murphree R, Warkentin JV, Dunn JR, Schaffner W, Jones TF. Elephant-to-human transmission of tuberculosis, 2009. Emerg Infect Dis. 2011;17:366–71. 10.3201/eid1703.101668 - DOI - PMC - PubMed
    1. Kiers A, Klarenbeek A, Mendelts B, Van Soolingen D, Koëter G. Transmission of Mycobacterium pinnipedii to humans in a zoo with marine mammals. Int J Tuberc Lung Dis. 2008;12:1469–73 . - PubMed

Publication types