Review
. 2014 Mar;114(3):545-59.
doi: 10.1007/s00421-013-2667-y. Epub 2013 Jun 5.

Blood pressure regulation IX: cerebral autoregulation under blood pressure challenges

Affiliations
Review

Blood pressure regulation IX: cerebral autoregulation under blood pressure challenges

Yu-Chieh Tzeng et al. Eur J Appl Physiol. 2014 Mar.

Abstract

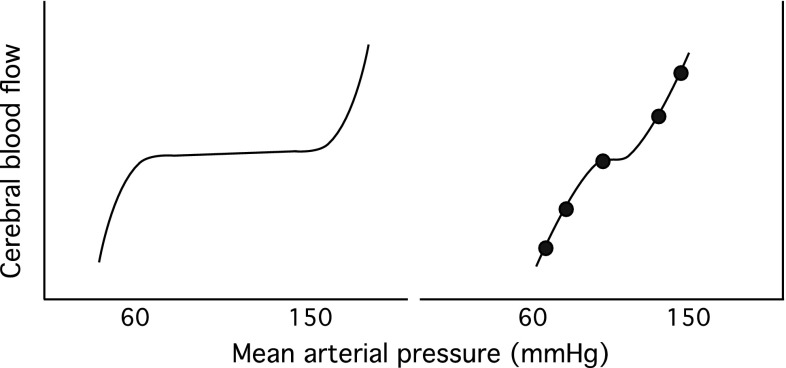
Cerebral autoregulation (CA) is integral to the delicate process of maintaining stable cerebral perfusion and brain tissue oxygenation against changes in arterial blood pressure. The last four decades has seen dramatic advances in understanding CA physiology, and the role that CA might play in the causation and progression of disease processes that affect the cerebral circulation such as stroke. However, the translation of these basic scientific advances into clinical practice has been limited by the maintenance of old constructs and because there are persistent gaps in our understanding of how this vital vascular mechanism should be quantified. In this review, we re-evaluate relevant studies that challenge established paradigms about how the cerebral perfusion pressure and blood flow are related. In the context of blood pressure being a major haemodynamic challenge to the cerebral circulation, we conclude that: (1) the physiological properties of CA remain inconclusive, (2) many extant methods for CA characterisation are based on simplistic assumptions that can give rise to misleading interpretations, and (3) robust evaluation of CA requires thorough consideration not only of active vasomotor function, but also the unique properties of the intracranial environment.


Figures

Fig. 1
Fig. 1
Stylised representation of the possible relationships between mean arterial pressure and cerebral blood flow. The left panel represents Lassen’s classic cerebral autoregulation curve. The curve on the right panel shows a more restricted autoregulatory plateau as indicated in recent studies (Tan 2012). Note that attempts to characterise static cerebral autoregulation using incremental drug infusion protocols may not reveal the plateau where blood pressure steps are greater than the width of the plateau (Lucas et al. 2010)
Fig. 2
Fig. 2
a Finger arterial blood pressure and middle cerebral blood flow velocity over 900 s (presented on log axes) for a human subject in the seated resting position. b The corresponding power spectrums, which decompose the time series signals into its various constituent component frequencies. Note that the fundamental frequency (f o) and its harmonics (f 1, f 2, f 3) correspond to pulsations coincident with the pulse, whereas progressively lower frequency components reflect the longer term oscillations and trends in the time domain. ULF ultra low frequency, VLF very low frequency, LF low frequency, HF high frequency
Fig. 3
Fig. 3
Mean cerebral blood flow (CBF), mean arterial blood pressure (MAP) and cerebrovascular conductance (CVC) estimated on a beat-to-beat basis for one subject during thigh cuff deflation (left panel) and during sit-to-stand (right panel). CBF estimates were made on the assumption that the middle cerebral artery radius is constant at 2 mm. Vertical dashed line indicates the time of thigh cuff deflation and stand. Both thigh deflation and standing from a sitting position elicited abrupt transient hypotension, although MAP recovery following cuff deflation occurred relatively slowly in this individual. Nevertheless, as indicated by the dark horizontal bars, CVC increased in a relatively linear fashion almost immediately (within one heart beat) following hypotension onset. The CBF plot shows the actual (dots) and CBF time course generated using Tieck’s autoregulatory model (dashed lines) (Tiecks et al. 1995). The rate of regulation index is typically calculated for the time period 1.0–3.5 s following the onset of thigh cuff deflation
Fig. 4
Fig. 4
Transfer function coherence, phase, gain and normalised gain for 105 healthy individuals (mean age 26 ± 7 years) in the supine resting position. Data adapted from (Tzeng et al. 2012). AU arbitrary units. Values are mean ± SE
Fig. 5
Fig. 5
Scatter plots showing the relationships between various metrics of dynamic cerebral autoregulation. a The relationships between autoregulatory index (ARI) and rate of regulation index (RoR) derived from thigh cuff deflations test and metrics derived from spontaneous transfer function analysis in the 0.07–0.2 Hz range (n = 29). ARI showed no clear relationships with any transfer function metric. RoR was positively related to phase and n-gain. The latter association does not support the conventional interpretation of these metrics, given that RoR and n-gain should be inversely related. b The relationships between RoR and ARI, which are metrics derived from the same pressure–flow recordings. Note the high degree of data dispersion compared to c, which shows the theoretically predicted relationship between RoR and ARI. All data are adapted from (Tzeng et al. 2012) and (Tiecks et al. 1995)
Fig. 6
Fig. 6
Schematic diagram illustrating how different conceptual paradigms can influence data interpretation. The top panel shows the popular implicit paradigm that assumes cerebral autoregulation (CA) as the principal determinant of cerebral pressure–flow velocity relationships. The bottom panel shows one potential alternative paradigm that accounts for inherent vascular properties such as resistance and compliance in addition to CA. Such alternative models require further experimental validation. Potential influences due to other processes such as neurovascular coupling and partial pressure of arterial are not shown

Comment in

References

    1. Aaslid R, Lindegaard KF, Sorteberg W, Nornes H. Cerebral autoregulation dynamics in humans. Stroke. 1989;20:45–52. - PubMed
    1. Aaslid R, Newell DW, Stooss R, Sorteberg W, Lindegaard KF. Assessment of cerebral autoregulation dynamics from simultaneous arterial and venous transcranial Doppler recordings in humans. Stroke. 1991;22:1148–1154. - PubMed
    1. Aaslid R, Lash SR, Bardy GH, Gild WH, Newell DW. Dynamic pressure–flow velocity relationships in the human cerebral circulation. Stroke. 2003;34:1645–1649. - PubMed
    1. Aaslid R, Blaha M, Sviri G, Douville CM, Newell DW. Asymmetric dynamic cerebral autoregulatory response to cyclic stimuli. Stroke. 2007;38:1465–1469. - PubMed
    1. Ainslie PN, Celi L, McGrattan K, Peebles K, Ogoh S. Dynamic cerebral autoregulation and baroreflex sensitivity during modest and severe step changes in arterial PCO2. Brain Res. 2008;1230:115–124. - PubMed

Publication types

LinkOut - more resources