

Biases in the experimental annotations of protein function and their effect on our understanding of protein function space
- PMID: 23737737
- PMCID: PMC3667760
- DOI: 10.1371/journal.pcbi.1003063
Biases in the experimental annotations of protein function and their effect on our understanding of protein function space
Abstract
The ongoing functional annotation of proteins relies upon the work of curators to capture experimental findings from scientific literature and apply them to protein sequence and structure data. However, with the increasing use of high-throughput experimental assays, a small number of experimental studies dominate the functional protein annotations collected in databases. Here, we investigate just how prevalent is the "few articles - many proteins" phenomenon. We examine the experimentally validated annotation of proteins provided by several groups in the GO Consortium, and show that the distribution of proteins per published study is exponential, with 0.14% of articles providing the source of annotations for 25% of the proteins in the UniProt-GOA compilation. Since each of the dominant articles describes the use of an assay that can find only one function or a small group of functions, this leads to substantial biases in what we know about the function of many proteins. Mass-spectrometry, microscopy and RNAi experiments dominate high throughput experiments. Consequently, the functional information derived from these experiments is mostly of the subcellular location of proteins, and of the participation of proteins in embryonic developmental pathways. For some organisms, the information provided by different studies overlap by a large amount. We also show that the information provided by high throughput experiments is less specific than those provided by low throughput experiments. Given the experimental techniques available, certain biases in protein function annotation due to high-throughput experiments are unavoidable. Knowing that these biases exist and understanding their characteristics and extent is important for database curators, developers of function annotation programs, and anyone who uses protein function annotation data to plan experiments.
Conflict of interest statement
The authors have declared that no competing interests exist.
Figures
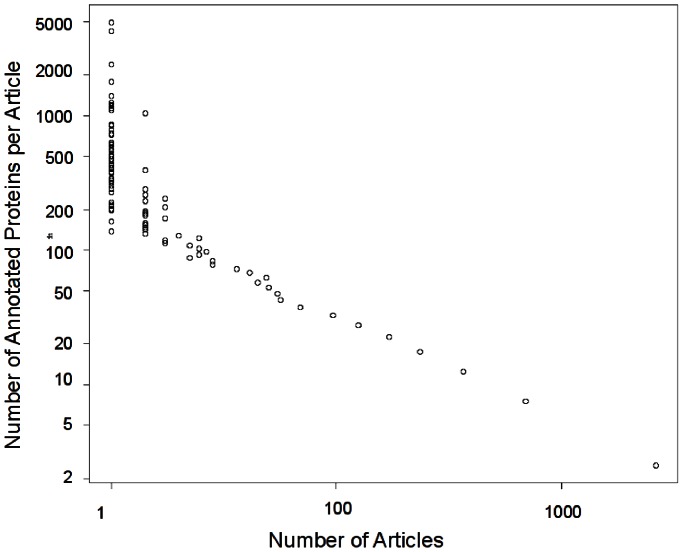
 ) linear fit to the log-log plot. The data came from 76137 articles annotating 256033 proteins with GO experimental evidence codes, in Uniprot-GOA 12/2011.
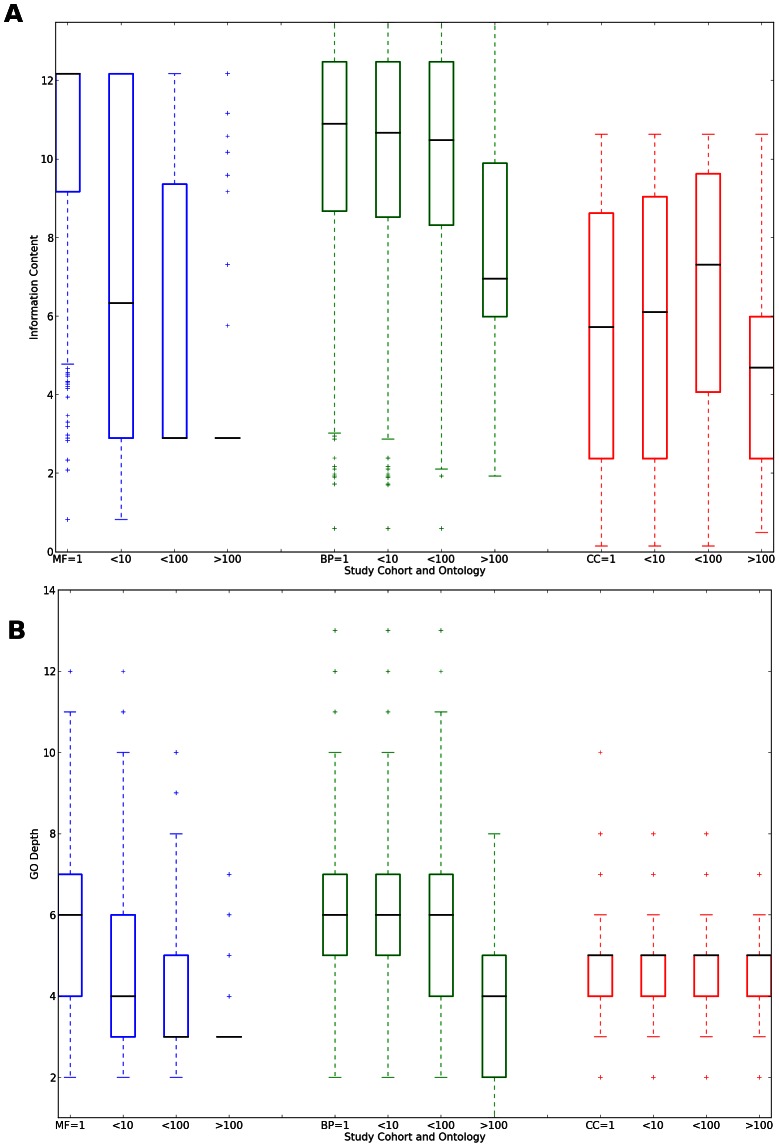
 : more than 1, up to 10 annotated;
  : more than 10, less than 100 annotated;
  : 100 or more proteins annotated per article. Blue bars: Molecular Function ontology; Green bars: Biological Process ontology; Red bars: Cellular Component ontology. Information is gauged by A: Information Content and B: GO depth. See text for details.
References
-
- Friedberg I (2006) Automated protein function prediction–the genomic challenge. Brief Bioinform 7: 225–242. - PubMed
-
- Rentzsch R, Orengo CA (2009) Protein function prediction the power of multiplicity. Trends in Biotechnology 27: 210–219. - PubMed
-
- Sthl PL, Lundeberg J (2012) Toward the single-hour high-quality genome. Annual Review of Biochemistry 81: 359–378. - PubMed
Publication types
MeSH terms
Substances
Grants and funding
LinkOut - more resources
Full Text Sources
Other Literature Sources
