. 2013 Nov;7(11):2069-79.
doi: 10.1038/ismej.2013.93. Epub 2013 Jun 6.

Quantifying community assembly processes and identifying features that impose them

Affiliations

Quantifying community assembly processes and identifying features that impose them

James C Stegen et al. ISME J. 2013 Nov.

Abstract

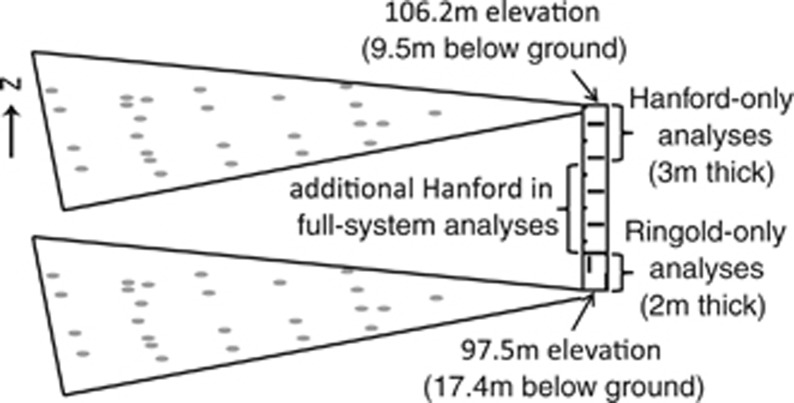
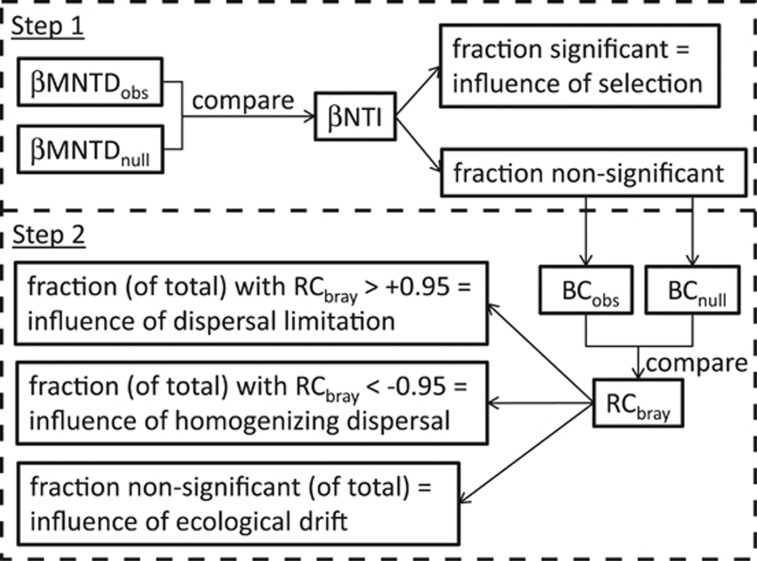
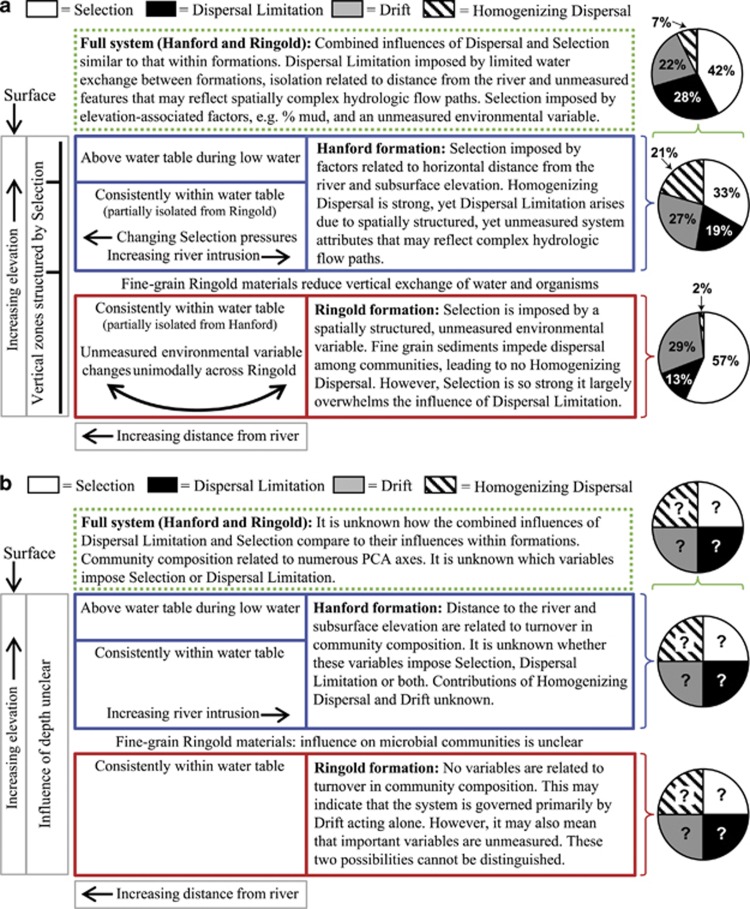
Spatial turnover in the composition of biological communities is governed by (ecological) Drift, Selection and Dispersal. Commonly applied statistical tools cannot quantitatively estimate these processes, nor identify abiotic features that impose these processes. For interrogation of subsurface microbial communities distributed across two geologically distinct formations of the unconfined aquifer underlying the Hanford Site in southeastern Washington State, we developed an analytical framework that advances ecological understanding in two primary ways. First, we quantitatively estimate influences of Drift, Selection and Dispersal. Second, ecological patterns are used to characterize measured and unmeasured abiotic variables that impose Selection or that result in low levels of Dispersal. We find that (i) Drift alone consistently governs ∼25% of spatial turnover in community composition; (ii) in deeper, finer-grained sediments, Selection is strong (governing ∼60% of turnover), being imposed by an unmeasured but spatially structured environmental variable; (iii) in shallower, coarser-grained sediments, Selection is weaker (governing ∼30% of turnover), being imposed by vertically and horizontally structured hydrological factors;(iv) low levels of Dispersal can govern nearly 30% of turnover and be caused primarily by spatial isolation resulting from limited exchange between finer and coarser-grain sediments; and (v) highly permeable sediments are associated with high levels of Dispersal that homogenize community composition and govern over 20% of turnover. We further show that our framework provides inferences that cannot be achieved using preexisting approaches, and suggest that their broad application will facilitate a unified understanding of microbial communities.


Figures

Figure 1
Figure 1
Sampling sites within the Hanford Integrated Field-Scale Research Challenge field site, located ∼250 m from the Columbia River in the Hanford Site 300 area. Gray circles show two-dimensional distribution of sampling locations; the maximum horizontal distance between any two communities is ∼53 m. The two geological formations (Hanford and Ringold) are shown with horizontal and vertical dashes, respectively. Our formation-specific analyses examine communities across the specific vertical ranges shown, whereas the ‘full-system' analyses include additional communities in the middle section of the Hanford.
Figure 2
Figure 2
Phylogenetic Mantel correlogram showing significant phylogenetic signal across short phylogenetic distances. Solid and open symbols denote significant and nonsignificant correlations, respectively, relating between-OTU niche differences to between-OTU phylogenetic distances across a given phylogenetic distance. An optimal elevation and an optimal percent mud were estimated for each species; these values were taken to be estimates of OTU environmental niches across both abiotic axes. Significantly positive correlations indicate that ecological niche distance between OTUs increases with their phylogenetic distance, but only across the phylogenetic distance class being evaluated (that is, there is phylogenetic signal in OTU environmental niches).
Figure 3
Figure 3
Flowchart summarizing procedure for estimating influences of ecological processes, broken into two major steps discussed in the section ‘Estimating influences of ecological processes.' First, the observed degree of phylogenetic turnover for each pairwise community comparison was quantified (βMNTDobs). A randomization was then used to generate a null distribution of phylogenetic turnover (βMNTDnull). The value of βNTI characterizes the magnitude of deviation between βMNTDobs and βMNTDnull. The fraction of pairwise comparisons with significant βNTI values (|βNTI|>2) is the estimated influence of Selection. As part of the second major step in our procedure, pairwise comparisons with nonsignificant βNTI values were further evaluated by comparing observed Bray–Curtis (BCobs) to Bray–Curtis expected under the randomization (BCnull). The value of Bray–Curtis-based Raup–Crick (RCbray) characterizes the magnitude of deviation between BCobs and BCnull; a value of |RCbray|>0.95 was considered significant. The number of pairwise comparisons with RCbray>+0.95, the number with RCbray<−0.95 and the number with |RCbray|<0.95 were each divided by the total number of all pairwise comparisons; the resulting fractions estimate the influence of Dispersal Limitation combined with Drift, Homogenizing Dispersal and Drift acting alone, respectively.
Figure 4
Figure 4
Summary of key insights and results for the three systems analyzed: Hanford (blue) and Ringold (red) formations and across the full system (green dashed box). For comparison, panels provide inferences based on (a) the framework developed here and (b) a preexisting framework. Pie charts give the percent of turnover in community composition governed primarily by Selection acting alone (white fill), Dispersal Limitation acting in concert with Drift (black fill), Drift acting alone (gray fill) and Homogenizing Dispersal (line fill).
Figure 5
Figure 5
Spatial variation in PCA axis 7 within the Ringold formation. PCA7 was identified as an influential, yet unmeasured, environmental variable using model selection for βNTI. The spatial configuration of PCA7 suggests that a key environmental variable changes unimodally along an axis running northwest to southeast. Axis (absolute) magnitude increases with circle diameter, with negative and positive values represented as open and closed circles, respectively.

References

    1. Adler PB, HilleRisLambers J, Levine JM. A niche for neutrality. Ecol Lett. 2007;10:95–104. - PubMed
    1. Anderson MJ, Crist TO, Chase JM, Vellend M, Inouye BD, Freestone AL, et al. Navigating the multiple meanings of β diversity: a roadmap for the practicing ecologist. Ecol Lett. 2011;14:19–28. - PubMed
    1. Andersson AF, Riemann L, Bertilsson S. Pyrosequencing reveals contrasting seasonal dynamics of taxa within Baltic Sea bacterioplankton communities. ISME J. 2010;4:171–181. - PubMed
    1. Bjornstad BN, Horner JA, Vermeul VR, Lanigan DC, Thorne PD. Borehole Completion and Conceptual Hydrogeologic Model for the IFRC Well Field, 300 Area, Hanford Site. PNNL-18340. Pacific Northwest National Laboratory: Richland, WA; 2009.
    1. Blanchet FG, Legendre P, Borcard D. Forward selection of explanatory variables. Ecology. 2008;89:2623–2632. - PubMed

Publication types