Review
. 2013 Jun;19(3 Epilepsy):598-622.
doi: 10.1212/01.CON.0000431378.51935.d8.

EEG and epilepsy monitoring

Affiliations
Review

EEG and epilepsy monitoring

Rama K Maganti et al. Continuum (Minneap Minn). 2013 Jun.

Abstract

Purpose of review: This article reviews the utility of EEG and prolonged video-EEG telemetry in the diagnosis and management of a patient with epilepsy.

Recent findings: The EEG can be the most helpful test to determine a diagnosis of epilepsy; it can also distinguish focal and generalized neurophysiologic correlates of epilepsy. Furthermore, when paired with video monitoring, EEG can not only define epileptic and nonepileptic events but also aid in localization of seizures in patients with epilepsy. Finally, when history and other imaging modalities are considered with the EEG, the epileptic syndrome can usually be defined and the treatment can be focused. In critically ill patients, continuous EEG monitoring can define subclinical seizures, although a variety of periodic patterns may also be identified.

Summary: EEG is an invaluable tool in the diagnosis and management of a patient with epilepsy, and continuous EEG monitoring is useful in identifying subclinical seizures and nonconvulsive status epilepticus in critically ill patients.


Figures

Figure 2-1.
Figure 2-1.
Schematic demonstrating a radial dipole typical of a focal interictal spike. The population of neurons that generate the dipole is depicted as a single pyramidal neuron. A large inward current in the apical dendrite generates a surface-negative potential, maximal at T4 (by convention, EEG depicts negative as an upward deflection). Following the spike is a negative, slower wave that is also surface-negative because of a similar dipole produced by potassium ions leaving the soma and chloride entering the soma, producing outward current at the soma. The traces on the right show a bipolar recording of the spike wave and show phase reversal at T4 localizing the surface negativity to the T4 electrode.
Figure 2-2.
Figure 2-2.
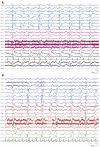
EEG from a patient with juvenile myoclonic epilepsy with more focal frontal spike-wave activity (A) that may also be seen as more generalized occurring at a frequency of 3 Hz (B).
Figure 2-3.
Figure 2-3.
EEG of photoparoxysmal response. Note that the patient is undergoing photic stimulation at 15 Hz (denoted by Ph at the bottom of the page), during which the patient is initially noted to have a posterior driving response (higher amplitude beta range activity at the beginning of the page) followed by a generalized spike-wave discharge that is anteriorly dominant.
Figure 2-4.
Figure 2-4.
EEG showing frontal intermittent rhythmic delta activity in a 70-year-old patient admitted with mental status changes. Note the rhythmic high-amplitude delta that waxes and wanes.
Figure 2-5.
Figure 2-5.
EEG showing triphasic waves in a 48-year-old patient with renal failure and obtundation. Note that the EEG shows triphasic waveforms that have maximal amplitude anteriorly and an anteroposterior lag.
Figure 2-6.
Figure 2-6.
EEG showing centrotemporal spikes in a patient with benign rolandic epilepsy. Note that the spikes are seen on the left side and have maximal amplitude and phase reverse in the temporal and central leads on the left (T3 and C3).
Figure 2-7.
Figure 2-7.
EEG recording from the patient described in Case 2-1. The patient felt a brief lapse and twitch of his jaw. The EEG correlate demonstrated generalized spike-wave activity occurring at 3 to 4Hz. Note that the patient pushes an event button that identifies he had a seizure.
Figure 2-8.
Figure 2-8.
EEG of rhythmic temporal delta activity seen best in the right temporal leads during an abdominal sensation in a patient with right hippocampal sclerosis. This activity appeared as an ictal pattern but also occurred at other times without any clinical symptoms. The patient is seizure free after a right anterior temporal lobectomy.
Figure 2-9.
Figure 2-9.
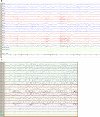
Normal variants or benign patterns. A, EEG of psychomotor variant or rhythmic midtemporal theta of drowsiness (RMTD). Note the theta range activity seen bilaterally but maximally in the temporal leads as the patient is becoming drowsy. B, EEG of small sharp spikes. Note the low-amplitude spikes of 50 μV or less in the temporal leads and note that the patient is also in light sleep.
Figure 2-9.
Figure 2-9.
Normal variants or benign patterns. C, EEG of wicket spikes. Note the phase-reversing sharp wave in left temporal leads that do not have an after-following slow wave and a rhythm that looks like a wicket fence. Note the sleep spindle/vertex wave later in the page suggesting light sleep. D, EEG of phantom spike and wave. Note the bisynchronous burst of 6-Hz activity with a spike component and with an amplitude of about 60 μV, occurring as a burst lasting 1 second.
Figure 2-9.
Figure 2-9.
Normal variants or benign patterns. E, EEG of 14 and 6 positive bursts. Note the 1-second burst of right-sided activity with spike components but occurring at 14 Hz in trains during drowsiness. F, EEG of subclinical rhythmic electrographic discharges of adults (SREDA). This EEG is from a 60-year-old patient during awake state where bilateral, sharply contoured theta activity is seen but does not alter the baseline alpha range activity posteriorly and almost looks like an ictal discharge, but patients generally do not have change in awareness. It has abrupt onset and offset and can be seen in wakefulness or during sleep.
Figure 2-10.
Figure 2-10.
Periodic EEG patterns. A, EEG of periodic lateralized discharges. Note that the EEG shows periodic sharp-wave discharges phase reversing in the right temporal leads. B, EEG of bilateral periodic discharges. Note the periodic discharges phase reversing in the frontal leads bilaterally and sometimes occurring asynchronously.
Figure 2-10.
Figure 2-10.
Periodic EEG patterns. C, EEG of generalized periodic discharges where there are periodic discharges that are seen bilaterally in a synchronous manner, with maximal amplitude frontally in a patient with anoxic brain injury.
Figure 2-11.
Figure 2-11.
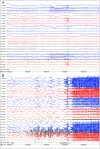
EEG from the patient described in Case 2-2. A, Note the normal awake pattern while patient is undergoing phlebotomy. B, Note the bilateral high amplitude slowing followed by flattening of EEG associated with muscle artifact that coincided with patient losing consciousness and having some tonic posturing.
Figure 2-11.
Figure 2-11.
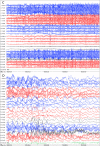
EEG from the patient described in Case 2-2. C, Note that the EEG remains flat along with muscle artifact with poorly discernible electrocerebral activity likely due to hypoperfusion during the period of asystole. D, Note resumption of EEG activity that coincided with the patient having a few clonic jerks and that followed resumption of ECG rhythm.
Figure 2-11.
Figure 2-11.
EEG from the patient described in Case 2-2. E, Note the recovery of normal alpha activity that coincided with patient recovery of normal consciousness where she started answering questions.

References

    1. Buzsáki G,, Anastassiou CA,, Koch C. The origin of extracellular fields and currents—EEG, ECoG, LFP and spikes. Nat Rev Neurosci 2012; 13 (6): 407–420. - PMC - PubMed
    1. Tao JX,, Ray A,, Hawes-Ebersole S,, Ebersole JS. Intracranial substrates of scalp EEG spikes. Epilepsia 2005; 46 (5): 669–676. - PubMed
    1. Devinsky O,, Sato S,, Kufta CV, et al. Electroencephalographic studies of simple partial seizures with subdural electrode recordings. Neurology 1989; 39 (4): 527–533. - PubMed
    1. McCormick DA,, Contreras D. On the cellular and network bases of epileptic seizures. Ann Rev Physiol 2001; 63: 815–846. - PubMed
    1. Jacobs J,, Staba R,, Asano E, et al. High frequency oscillations (HFOs) in clinical epilepsy. Prog Neurobiol 2012; 98 (3): 302–315. - PMC - PubMed