. 2013 Jun 18;110(25):E2317-26.
doi: 10.1073/pnas.1307002110. Epub 2013 Jun 5.

Integrated platform for genome-wide screening and construction of high-density genetic interaction maps in mammalian cells

Affiliations

Integrated platform for genome-wide screening and construction of high-density genetic interaction maps in mammalian cells

Martin Kampmann et al. Proc Natl Acad Sci U S A. .

Abstract

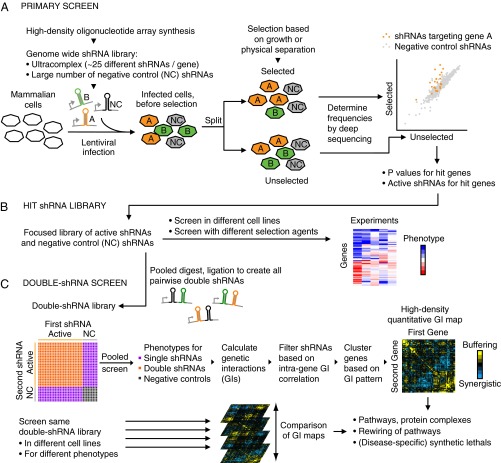
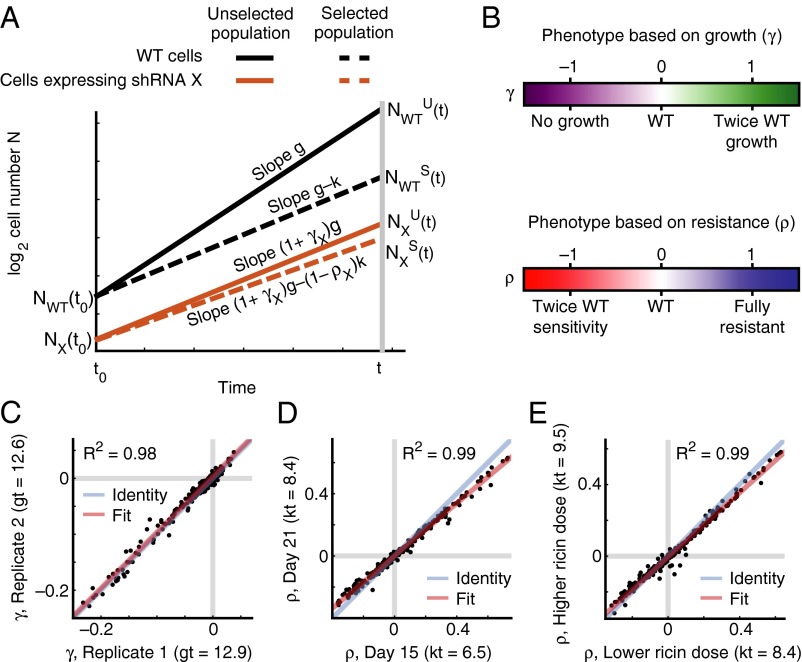
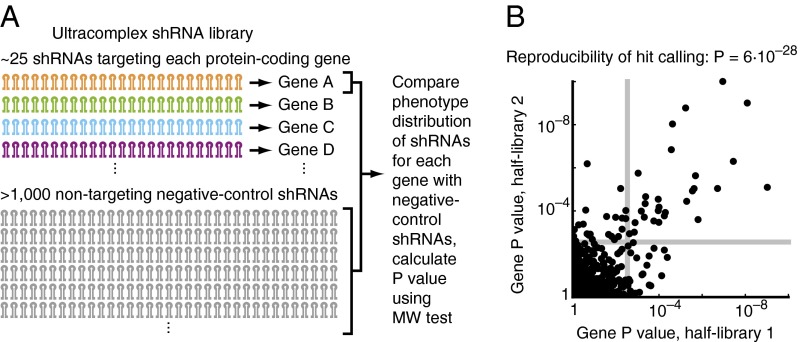
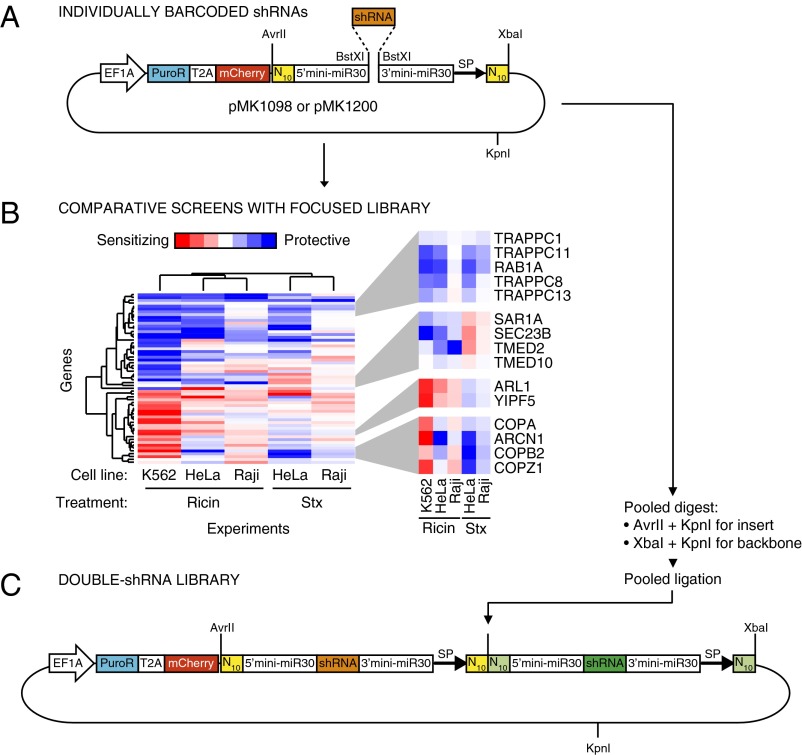
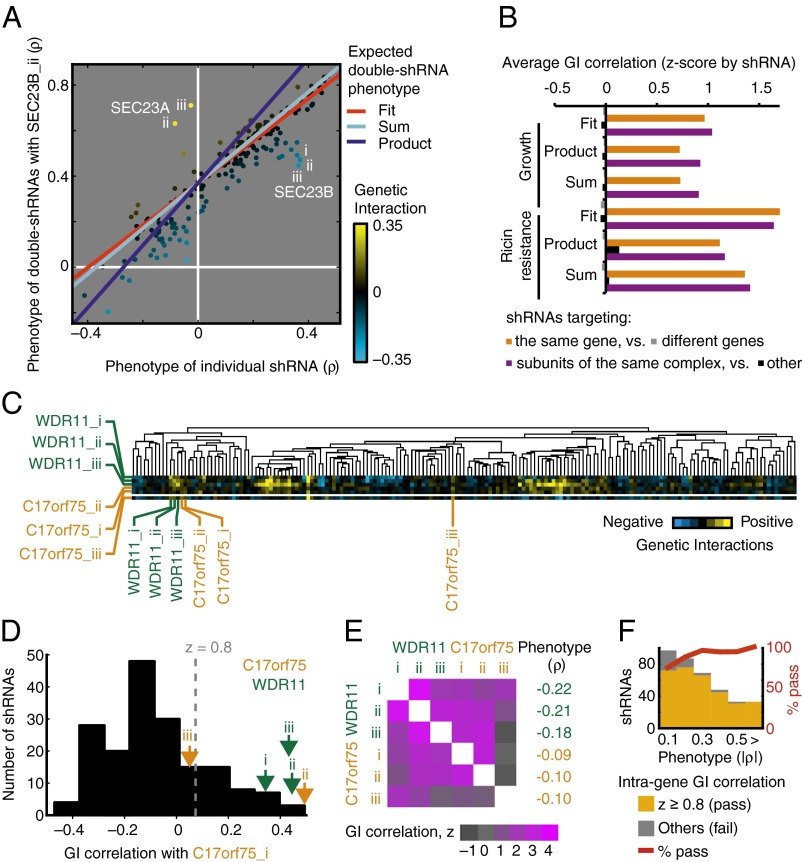
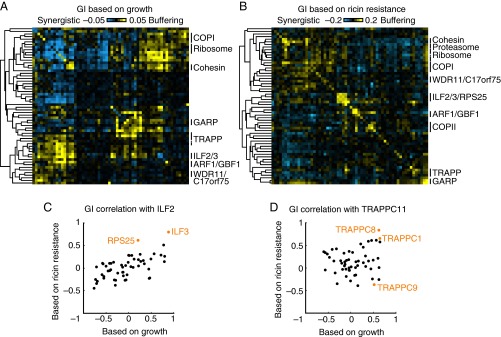
A major challenge of the postgenomic era is to understand how human genes function together in normal and disease states. In microorganisms, high-density genetic interaction (GI) maps are a powerful tool to elucidate gene functions and pathways. We have developed an integrated methodology based on pooled shRNA screening in mammalian cells for genome-wide identification of genes with relevant phenotypes and systematic mapping of all GIs among them. We recently demonstrated the potential of this approach in an application to pathways controlling the susceptibility of human cells to the toxin ricin. Here we present the complete quantitative framework underlying our strategy, including experimental design, derivation of quantitative phenotypes from pooled screens, robust identification of hit genes using ultra-complex shRNA libraries, parallel measurement of tens of thousands of GIs from a single double-shRNA experiment, and construction of GI maps. We describe the general applicability of our strategy. Our pooled approach enables rapid screening of the same shRNA library in different cell lines and under different conditions to determine a range of different phenotypes. We illustrate this strategy here for single- and double-shRNA libraries. We compare the roles of genes for susceptibility to ricin and Shiga toxin in different human cell lines and reveal both toxin-specific and cell line-specific pathways. We also present GI maps based on growth and ricin-resistance phenotypes, and we demonstrate how such a comparative GI mapping strategy enables functional dissection of physical complexes and context-dependent pathways.

Keywords: RNA interference; epistasis; functional genomics; human genome; synthetic lethality.


Conflict of interest statement

The authors declare no conflict of interest.

Figures

Fig. 1.
Fig. 1.
Overview of the technology platform. (A) Primary screen. (B) Focused shRNA library targeting hit genes from the primary screen. (C) Double shRNA screen and Genetic Interaction (GI) maps.
Fig. 2.
Fig. 2.
Quantitative framework for quantitative phenotypes from pooled screens. (A) Illustration of exponential growth of WT cells (black) and cells expressing an shRNA X (orange) under standard conditions (unselected population, solid lines) or selective pressure (selected population, dashed lines). shRNA X affects the growth rate g for unselected cells by a factor (1 + γX) and the selective pressure k by a factor (1 – ρX). (B) Illustration of the biological meaning of the quantitative phenotypes γ and ρ. (C–E) Agreement between shRNA phenotypes. Gray lines: WT phenotype. (C) K562 cell growth γs from two independent experimental replicates. (D) K562 cell ricin resistance ρs determined at different time points of the same experiment. (E) K562 cell ricin resistance ρs from experiments with slightly different doses of ricin.
Fig. 3.
Fig. 3.
Robust identification of hit genes from primary screens with an ultra-complex shRNA library. (A) Our current ultra-complex shRNA library targets each human protein-coding gene with ∼25 shRNAs and also contains >1,000 negative-control shRNAs not targeting any human transcript. To detect hits in the primary screen, P values for each gene were calculated using the MW test by comparing phenotypes of shRNAs targeting each gene with the phenotypes of negative-control shRNAs. (B) A ricin resistance screen was carried out in K562 cells with a test library targeting 1,079 genes with 50 shRNAs each. For analysis, the shRNAs targeting each gene were divided randomly into two groups of 25 shRNAs; P values for each gene were calculated based on these half-libraries and are plotted here. Genes were called hits for an FDR < 5% (gray lines). The overlap in called hits based on the two half-libraries is highly significant (P = 6 × 10⁻²⁸, Fisher’s exact test).
Fig. 4.
Fig. 4.
Cloning of hit shRNAs for focused comparative screens and construction of double-shRNA libraries. (A) shRNAs selected from the primary screen are cloned individually into a minimal miR30 context flanked by N10 barcodes on either side. (B) The focused library of hit shRNAs can be screened rapidly in different cell lines and for different phenotypes. Here, results are shown for ricin resistance in K562, HeLa, and RajiB cells and for Shiga toxin (Stx) resistance in HeLa and RajiB cells. Functionally related groups of genes show related phenotypic profiles across experiments, as revealed by hierarchical clustering (applied to the t statistic obtained from the phenotype distribution of shRNAs targeting a given gene in two experimental replicates). Highlighted examples of such functional groups are discussed in the text. (C) A double-shRNA library is created by a pooled restriction digest and ligation strategy. In the resulting plasmids, two shRNAs are expressed each from a miR30 context in the 3′ UTR of the same mRNA. A combinatorial barcode created at the junction uniquely identifies each double shRNA. SP, primer binding site for deep sequencing.
Fig. 5.
Fig. 5.
Derivation of genetic interactions from double-shRNA phenotypes. Data from growth and ricin resistance screens in K562 cells. (A) Genetic interactions are calculated as deviations from the expected double-mutant phenotype, which can be defined as product (dark blue) or sum (light blue) of the single mutant phenotypes or can be derived empirically by linearly fitting (red) the relationship between single shRNA phenotypes and double-shRNA phenotypes in combination with an shRNA of interest (in this example SEC23B_ii). The heatmap displays GIs from negative (cyan) to positive (yellow), based on the linear fit for expected double-shRNA phenotypes. (B) Comparison of biologically meaningful information obtained using the different definitions of expected double-shRNA phenotypes. Average correlation z-scores of GIs between shRNAs targeting the same gene (orange), compared with shRNAs targeting different genes (light gray), and shRNAs targeting genes encoding subunits of the same protein complex (purple) compared with others (dark gray). (C and D) GI patterns are compared for shRNAs targeting the physically interacting proteins WDR11 and C17orf75 to detect off-target effects. (C) Hierarchical clustering of GI patterns (excerpt of dataset), heatmap display of GIs from negative (cyan) to positive (yellow). (D) Distribution of correlation coefficients of GI patterns between C17orf75_i and all other shRNAs; GI correlations for shRNAs targeting WDR11 and C17orf75 are indicated by arrows. (E) GI correlations for all pairwise combinations of shRNAs targeting WDR11 and C17orf75, shown as heatmap of z values based on normalization of all GI correlation coefficients for the shRNA denoting the column. Phenotypes of individual shRNAs are listed. (F) In the ricin resistance double-shRNA screen, lack of high GI correlation for shRNAs targeting the same gene was more common for shRNAs with weaker phenotypes. The absolute values of ricin resistance, |ρ|, are binned; numbers refer to the upper bounds of the bins, and the last bin contains all cases exceeding the previous bound, as indicated by the > sign. Numbers of shRNAs passing or failing the intragene GI correlation cutoff of z = 0.8 are shown as orange and gray bars, respectively. The percentage of active shRNAs per bin is indicated by the red line.
Fig. 6.
Fig. 6.
Growth-based and differential GI maps reveal protein complexes and pathways. (A and B) GI maps based on growth and ricin resistance, respectively, in K562 cells. Heatmap display of synergistic (cyan) and buffering (yellow) GIs. Groups of genes encoding known functionally or physically interacting proteins are labeled on the right.(Figs. S5 and S6 are fully labeled versions of these GI maps.) (C and D) Differences in GI correlation patterns between the growth-based and the ricin resistance-based GI maps. (C) GI pattern correlation between ILF2 and the other genes in the GI map (black). Two genes are highlighted in orange: ILF3, which together with ILF2 encodes the two subunits of the ILF2/3 complex, and RPS25, which shows a highly correlated GI pattern with ILF2 only based on ricin resistance. (D) GI pattern correlation between TRAPPC11 and the other genes in the GI map (black). Three genes are highlighted in orange: TRAPPC8, which we propose to be a member of a specialized TRAPP complex with TRAPPC11; TRAPPC9, which we propose to be a member of a different specialized TRAPP complex; and TRAPPC1, presumably a constitutive member of all TRAPP complexes. Dissection of the two specialized TRAPP complexes is possible only based on ricin resistance, not simply on growth.

References

    1. Lander ES, et al. International Human Genome Sequencing Consortium Initial sequencing and analysis of the human genome. Nature. 2001;409(6822):860–921. - PubMed
    1. Venter JC, et al. The sequence of the human genome. Science. 2001;291(5507):1304–1351. - PubMed
    1. Abecasis GR, et al. 1000 Genomes Project Consortium An integrated map of genetic variation from 1,092 human genomes. Nature. 2012;491(7422):56–65. - PMC - PubMed
    1. Mardis ER. Genome sequencing and cancer. Curr Opin Genet Dev. 2012;22(3):245–250. - PMC - PubMed
    1. Kaelin WG., Jr Molecular biology. Use and abuse of RNAi to study mammalian gene function. Science. 2012;337(6093):421–422. - PMC - PubMed

Publication types

Substances