. 2013 Jun 5;33(23):9855-65.
doi: 10.1523/JNEUROSCI.3009-12.2013.

Characterizing functional integrity: intraindividual brain signal variability predicts memory performance in patients with medial temporal lobe epilepsy

Affiliations

Characterizing functional integrity: intraindividual brain signal variability predicts memory performance in patients with medial temporal lobe epilepsy

Andrea B Protzner et al. J Neurosci. .

Abstract

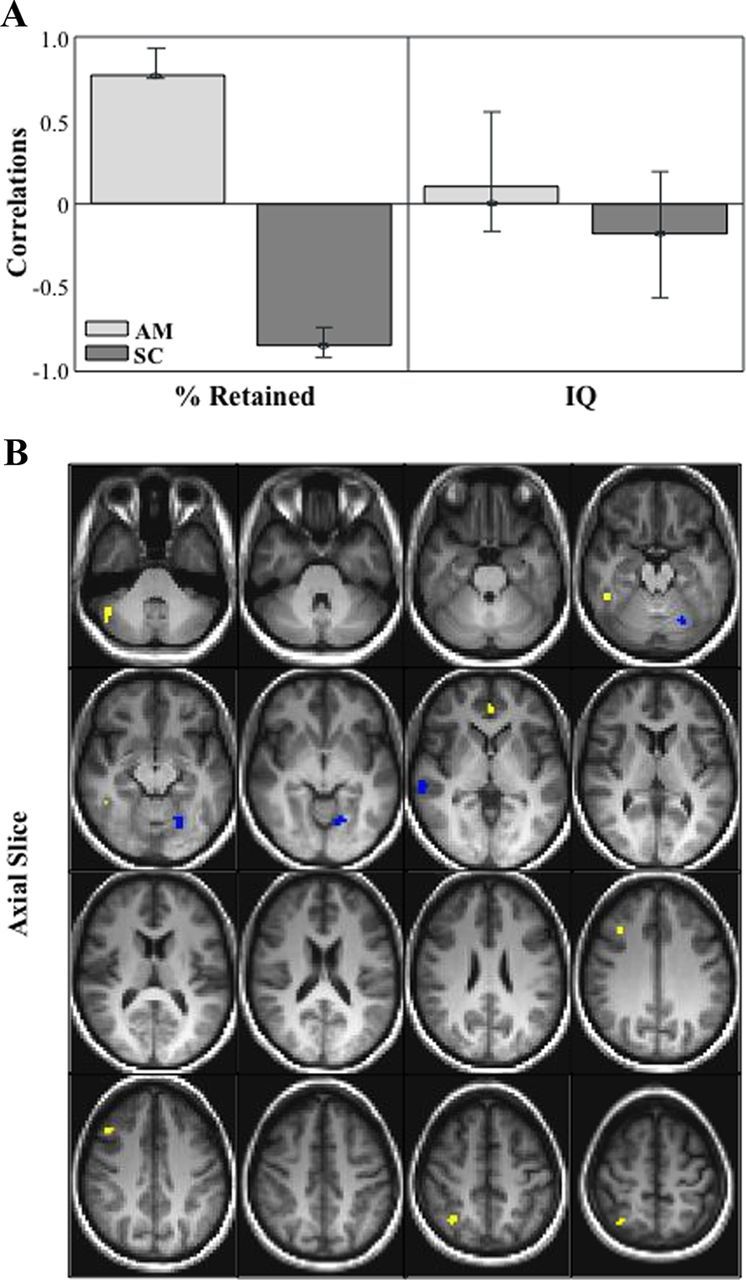
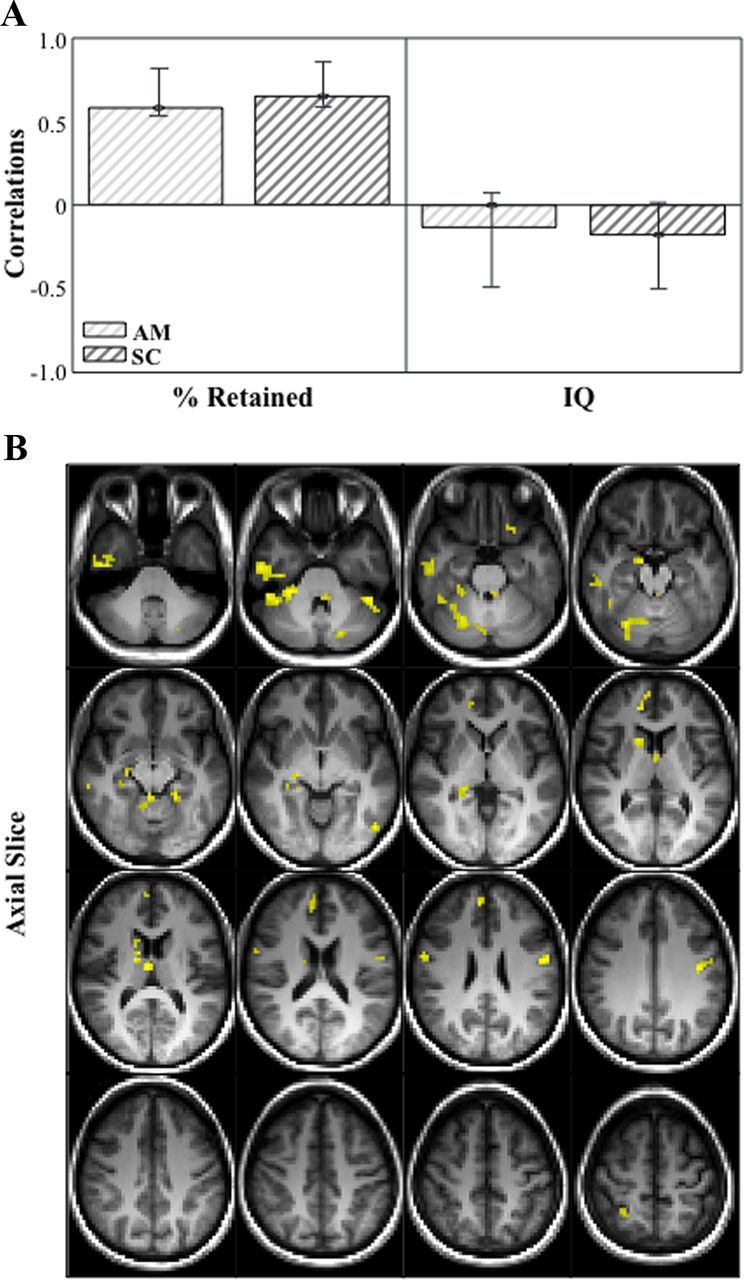
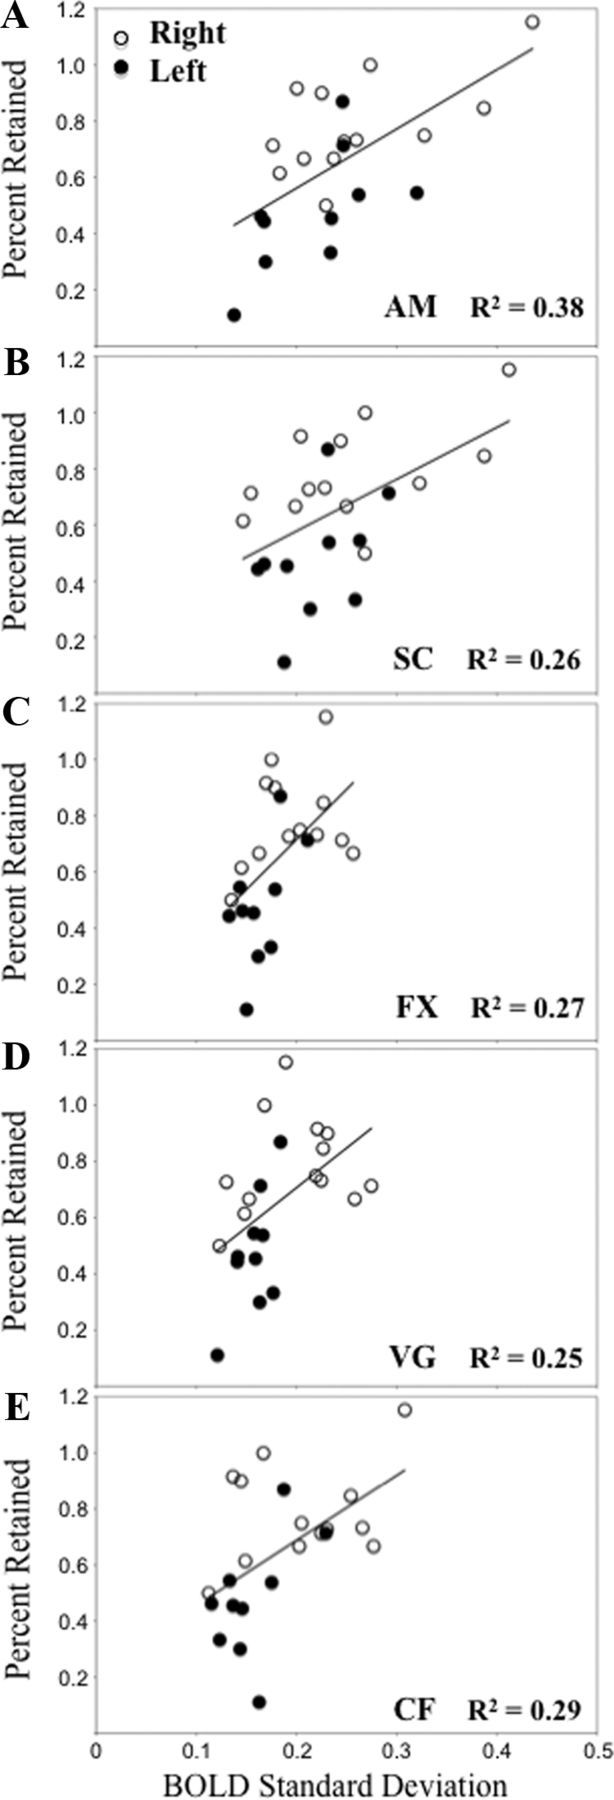
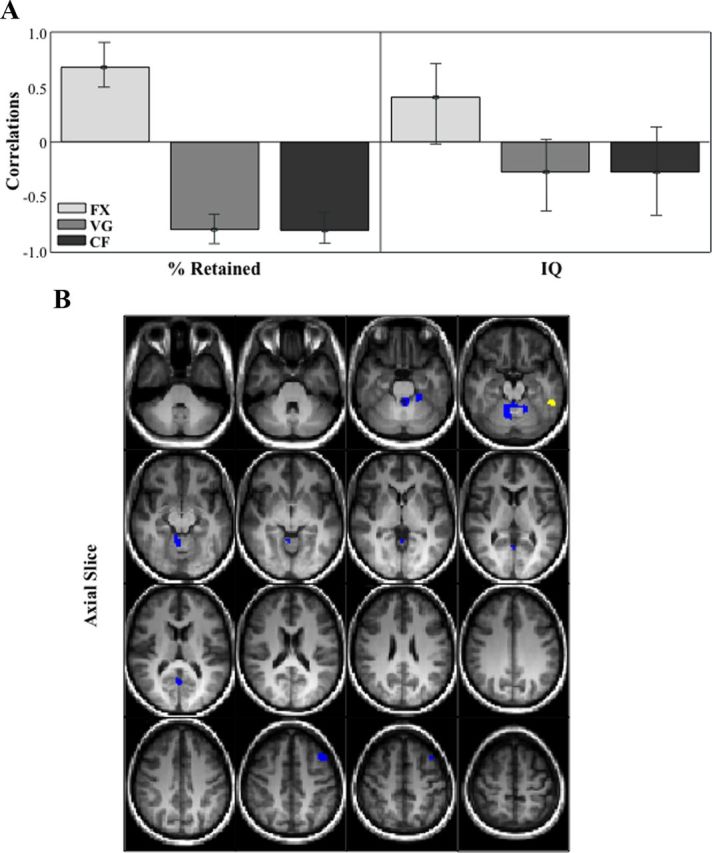
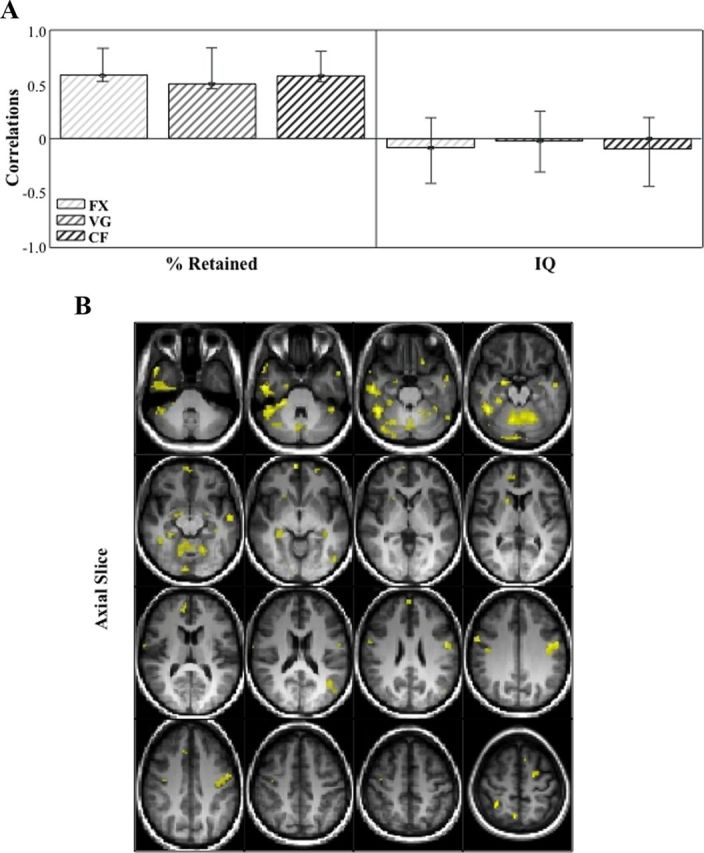
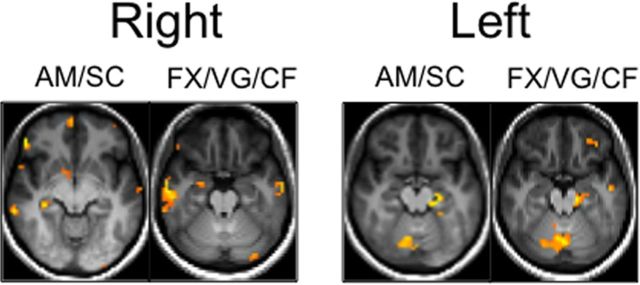
Computational modeling suggests that variability in brain signals provides important information regarding the system's capacity to adopt different network configurations that may promote optimal responding to stimuli. Although there is limited empirical work on this construct, a recent study indicates that age-related decreases in variability across the adult lifespan correlate with less efficient and less accurate performance. Here, we extend this construct to the assessment of cerebral integrity by comparing fMRI BOLD variability and fMRI BOLD amplitude in their ability to account for differences in functional capacity in patients with focal unilateral medial temporal dysfunction. We were specifically interested in whether either of these BOLD measures could identify a link between the affected medial temporal region and memory performance (as measured by a clinical test of verbal memory retention). Using partial least-squares analyses, we found that variability in a set of regions including the left hippocampus predicted verbal retention and, furthermore, this relationship was similar across a range of cognitive tasks measured during scanning (i.e., the same pattern was seen in fixation, autobiographical recall, and word generation). In contrast, signal amplitude in the hippocampus did not predict memory performance, even for a task that reliably activates the medial temporal lobes (i.e., autobiographical recall). These findings provide a powerful validation of the concept that variability in brain signals reflects functional integrity. Furthermore, this measure can be characterized as a robust biomarker in this clinical setting because it reveals the same pattern regardless of cognitive challenge or task engagement during scanning.


Figures

Figure 1.
Figure 1.
A, Correlation bar graph and singular image (B) for LV1 from the mean fMRI Signal in autobiographical memory and sentence completion behavior-PLS analysis. The correlation bar graph (A) captures the task-dependent correlations between our behavior measures (percent retained and IQ) and the regions identified in the singular image. The error bars show the 95% confidence interval derived from bootstrap estimation. The error bar crosses zero for IQ scores in both AM and SC tasks, indicating that there is no stable contribution from IQ to the pattern identified in the singular image. B, The singular image shows brain-behavior correlations for AM and SC, displayed on axial slices in MNI atlas space. The brain is displayed according to radiological convention (L = R). Regions highlighted in in yellow indicate a positive correlation between increased brain activity during AM and better verbal memory performance. Regions highlighted in blue indicating a positive correlation between increased brain activity during SC and better verbal memory performance. SC, Sentence completion.
Figure 2.
Figure 2.
Correlation bar graph (A) and singular image (B) for LV1 from the SD in fMRI signal in autobiographical memory and sentence completion behavior-PLS analysis. The correlation bar graph (A) captures the task-dependent correlations between our behavior measures (percent retained and IQ) and the regions identified in the singular image. The error bars show the 95% confidence interval derived from bootstrap estimation. The error bar crosses zero for IQ scores in both AM and SC tasks, indicating that there is no stable contribution from IQ to the pattern identified in the singular image. The singular image (B) shows brain signal variability-behavior correlations for AM and SC, displayed on axial slices in MNI atlas space. The brain is displayed according to radiological convention (L = R). Regions highlighted in in yellow indicate a positive correlation between brain variability in both tasks and memory performance.
Figure 3.
Figure 3.
Correlation between BOLD SD in our most representative hippocampal voxel (i.e., the one with the highest bootstrap ratio) and percent retained from the autobiographical memory and sentence completion analysis (A, B; MNI voxel coordinate −18.0 −33.0 −6.0), and the fixation, verb generation and category fluency analysis (CE; MNI voxel coordinate 24.0 −33.0 −6.0). FX, Fixation; VG, verb generation; CF, category fluency.
Figure 4.
Figure 4.
Correlation bar graph (A) and singular image (B) for LV1 from the mean fMRI signal in fixation, verb generation and category fluency behavior-PLS analysis. The correlation bar graph (A) captures the task-dependent correlations between our behavior measures (percent retained and IQ) and the regions identified in the singular image. The error bars show the 95% confidence interval derived from bootstrap estimation. The error bar crosses zero for IQ scores in all three tasks, indicating that there is no stable contribution from IQ to the pattern identified in the singular image. The singular image (B) shows brain-behavior correlations for FX, VG, and CF, displayed on axial slices in MNI atlas space. The brain is displayed according to radiological convention (L = R). Regions highlighted in in yellow indicate a positive correlation between increased brain activity during FX and better verbal memory performance. Regions highlighted in blue indicating a positive correlation between increased brain activity during VG and SC and better verbal memory performance.
Figure 5.
Figure 5.
Correlation bar graph (A) and singular image (B) for LV1 from the SD of fMRI signal in fixation, verb generation and category fluency behavior-PLS analysis. The correlation bar graph (A) captures the task-dependent correlations between our behavior measures (percent retained and IQ) and the regions identified in the singular image. The error bars show the 95% confidence interval derived from bootstrap estimation. The error bar crosses zero for IQ scores in all three tasks, indicating that there is no stable contribution from IQ to the pattern identified in the singular image. The singular image (B) shows brain signal variability; behavior correlations for FX, VG, and CF, displayed on axial slices in MNI atlas space. The brain is displayed according to radiological convention (L = R). Regions highlighted in yellow indicate a positive correlation between increased brain variability during all three tasks and better verbal memory performance.
Figure 6.
Figure 6.
Axial slices, displayed according to radiological convention (L = R), showing the hippocampal voxels that were most reliably associated with percent retained (i.e., the voxels with the highest bootstrap ratio) in analyses performed with left and right mTLE Patients in separate groups.

References

    1. Addis DR, Moscovitch M, McAndrews MP. Consequences of hippocampal damage across the autobiographical memory network in left temporal lobe epilepsy. Brain. 2007;130:2327–2342. doi: 10.1093/brain/awm166. - DOI - PubMed
    1. Beckmann CF, Smith SM. Probabilistic independent component analysis for functional magnetic resonance imaging. IEEE Trans Med Imaging. 2004;23:137–152. doi: 10.1109/TMI.2003.822821. - DOI - PubMed
    1. Bonelli SB, Powell RH, Yogarajah M, Samson RS, Symms MR, Thompson PJ, Koepp MJ, Duncan JS. Imaging memory in temporal lobe epilepsy: predicting the effects of temporal lobe resection. Brain. 2010;133:1186–1199. doi: 10.1093/brain/awq006. - DOI - PMC - PubMed
    1. Chelune GJ. Hippocampal adequacy versus functional reserve: predicting memory functions following temporal lobectomy. Arch Clin Neuropsychol. 1995;10:413–432. doi: 10.1093/arclin/10.5.413. - DOI - PubMed
    1. Chen XJ, Kovacevic N, Lobaugh NJ, Sled JG, Henkelman RM, Henderson JT. Neuroanatomical differences between mouse strains as shown by high-resolution 3D MRI. Neuroimage. 2006;29:99–105. doi: 10.1016/j.neuroimage.2005.07.008. - DOI - PubMed

Publication types

LinkOut - more resources