

Improving efficiency of human pluripotent stem cell differentiation platforms using an integrated experimental and computational approach
- PMID: 23740478
- PMCID: PMC3970199
- DOI: 10.1002/bit.24968
Improving efficiency of human pluripotent stem cell differentiation platforms using an integrated experimental and computational approach
Abstract
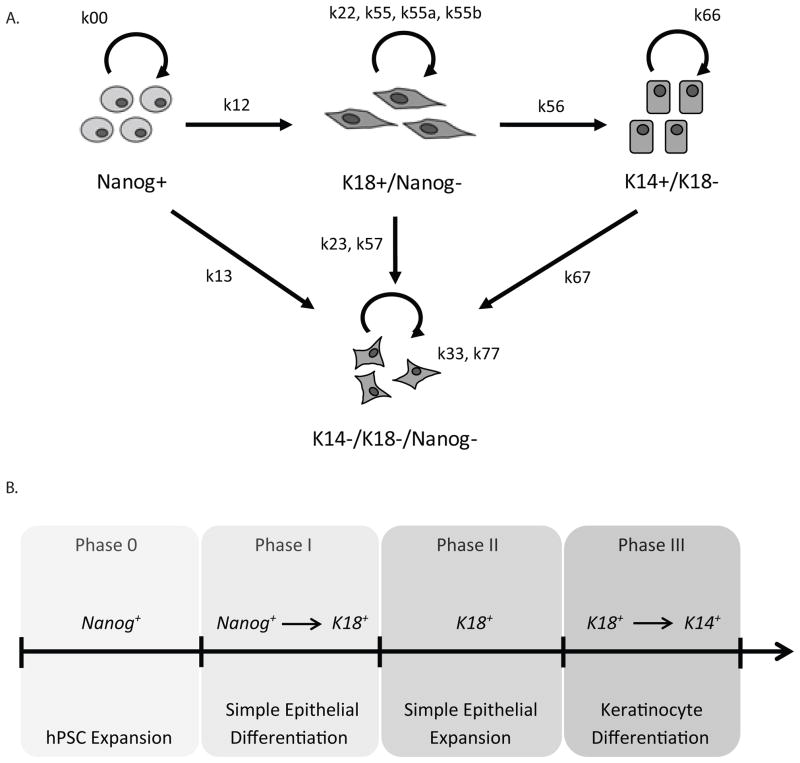
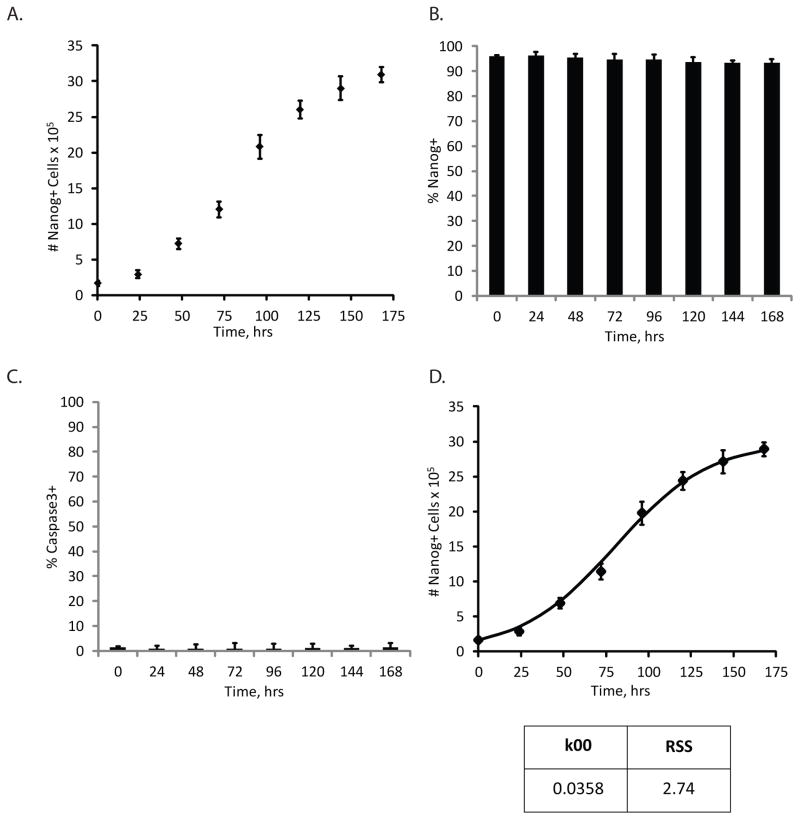
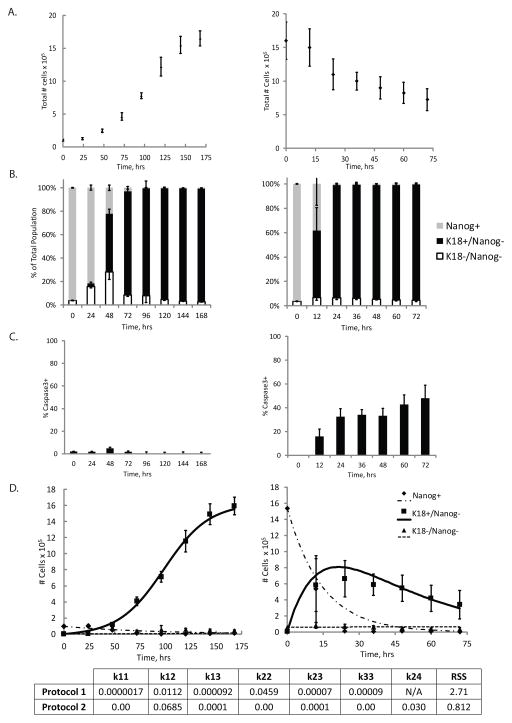
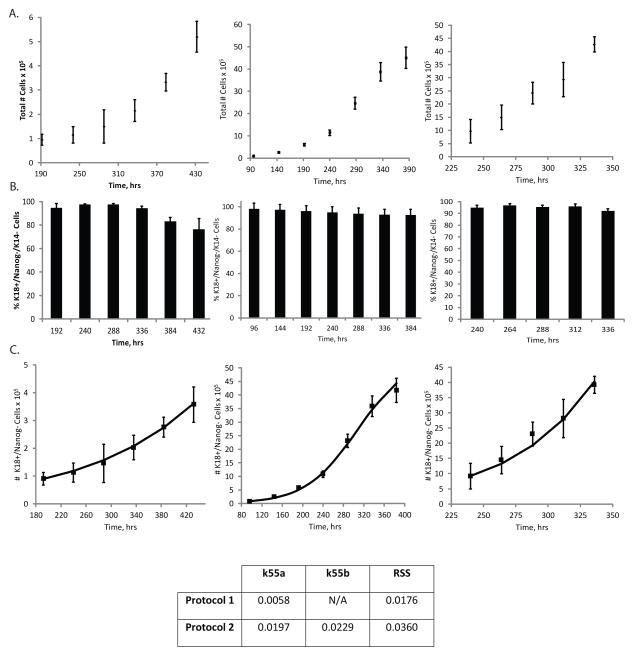
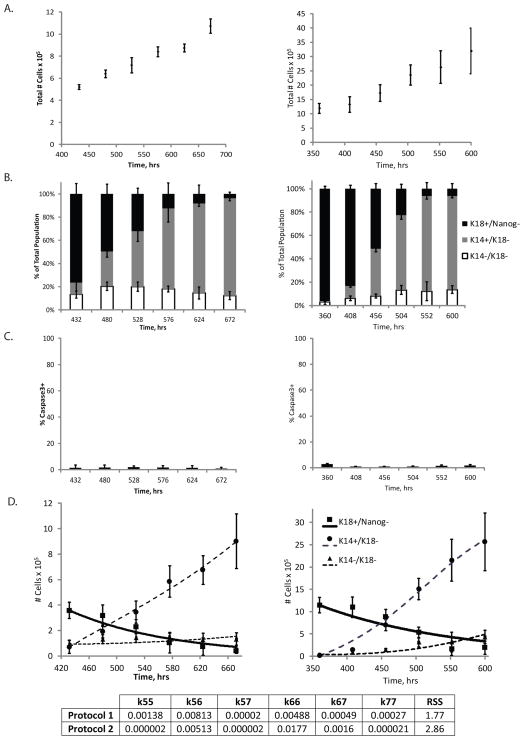
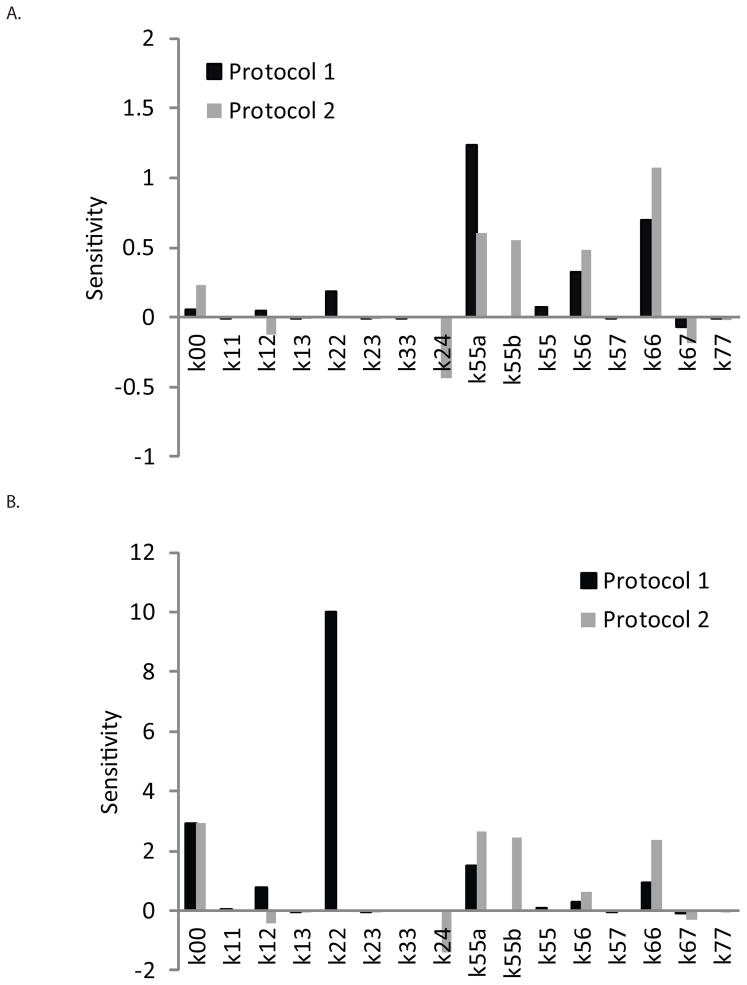
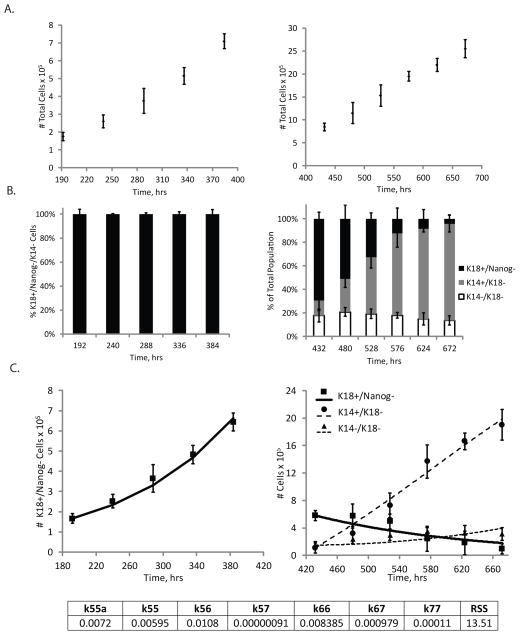
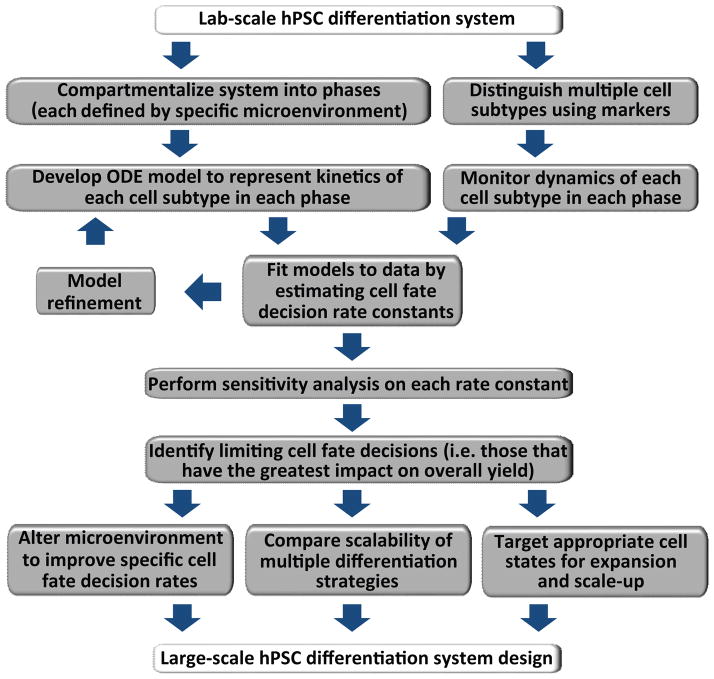
Human pluripotent stem cells (hPSCs) have an unparalleled potential for tissue engineering applications including regenerative therapies and in vitro cell-based models for studying normal and diseased tissue morphogenesis, or drug and toxicological screens. While numerous hPSC differentiation methods have been developed to generate various somatic cell types, the potential of hPSC-based technologies is hinged on the ability to translate these established lab-scale differentiation systems to large-scale processes to meet the industrial and clinical demands for these somatic cell types. Here, we demonstrate a strategy for investigating the efficiency and scalability of hPSC differentiation platforms. Using two previously reported epithelial differentiation systems as models, we fit an ODE-based kinetic model to data representing dynamics of various cell subpopulations present in our culture. This fit was performed by estimating rate constants of each cell subpopulation's cell fate decisions (self-renewal, differentiation, death). Sensitivity analyses on predicted rate constants indicated which cell fate decisions had the greatest impact on overall epithelial cell yield in each differentiation process. In addition, we found that the final cell yield was limited by the self-renewal rate of either the progenitor state or the final differentiated state, depending on the differentiation protocol. Also, the relative impact of these cell fate decision rates was highly dependent on the maximum capacity of the cell culture system. Overall, we outline a novel approach for quantitative analysis of established laboratory-scale hPSC differentiation systems and this approach may ease development to produce large quantities of cells for tissue engineering applications.
Keywords: cell fate self-renewal; differentiation; expansion; model; parameter estimation; pluripotent stem cell; scale-up.
© 2013 Wiley Periodicals, Inc.
Conflict of interest statement
Figures
Similar articles
-
Engineering the human pluripotent stem cell microenvironment to direct cell fate.Biotechnol Adv. 2013 Nov 15;31(7):1002-19. doi: 10.1016/j.biotechadv.2013.03.002. Epub 2013 Mar 17. Biotechnol Adv. 2013. PMID: 23510904 Free PMC article. Review.
-
Microcarrier-based platforms for in vitro expansion and differentiation of human pluripotent stem cells in bioreactor culture systems.J Biotechnol. 2016 Sep 20;234:71-82. doi: 10.1016/j.jbiotec.2016.07.023. Epub 2016 Jul 29. J Biotechnol. 2016. PMID: 27480342 Review.
-
Exploring the effects of cell seeding density on the differentiation of human pluripotent stem cells to brain microvascular endothelial cells.Fluids Barriers CNS. 2015 May 21;12:13. doi: 10.1186/s12987-015-0007-9. Fluids Barriers CNS. 2015. PMID: 25994964 Free PMC article.
-
Engineering 3D micro-compartments for highly efficient and scale-independent expansion of human pluripotent stem cells in bioreactors.Biomaterials. 2023 Apr;295:122033. doi: 10.1016/j.biomaterials.2023.122033. Epub 2023 Feb 2. Biomaterials. 2023. PMID: 36764194
-
A Universal and Robust Integrated Platform for the Scalable Production of Human Cardiomyocytes From Pluripotent Stem Cells.Stem Cells Transl Med. 2015 Dec;4(12):1482-94. doi: 10.5966/sctm.2014-0275. Epub 2015 Oct 28. Stem Cells Transl Med. 2015. PMID: 26511653 Free PMC article.
Cited by
-
Quality cell therapy manufacturing by design.Nat Biotechnol. 2016 Apr;34(4):393-400. doi: 10.1038/nbt.3525. Nat Biotechnol. 2016. PMID: 27054995
-
Engineering Hydrogel Microenvironments to Recapitulate the Stem Cell Niche.Annu Rev Biomed Eng. 2018 Jun 4;20:21-47. doi: 10.1146/annurev-bioeng-062117-120954. Epub 2017 Dec 8. Annu Rev Biomed Eng. 2018. PMID: 29220201 Free PMC article. Review.
-
Influence of substrate composition on human embryonic stem cell differentiation and extracellular matrix production in embryoid bodies.Biotechnol Prog. 2015 Jan-Feb;31(1):212-9. doi: 10.1002/btpr.2001. Epub 2014 Oct 28. Biotechnol Prog. 2015. PMID: 25311359 Free PMC article.
References
-
- Aberdam E, Barak E, Rouleau M, de LaForest S, Berrih-Aknin S, Suter D, Krause K, Amit M, Itskovitz-Eldor J, Aberdam D. A pure population of ectodermal cells derived from human embryonic stem cells. Stem Cells. 2008;26(2):440–4. - PubMed
-
- Ackleh AS, Thibodeaux JJ. Parameter estimation in a structured erythropoiesis model. Math Biosci Eng. 2008;5(4):601–16. - PubMed
-
- Cabrita GJ, Ferreira BS, da Silva CL, Gonçalves R, Almeida-Porada G, Cabral JM. Hematopoietic stem cells: from the bone to the bioreactor. Trends Biotechnol. 2003;21(5):233–40. - PubMed
-
- Cameron CM, Hu WS, Kaufman DS. Improved development of human embryonic stem cell-derived embryoid bodies by stirred vessel cultivation. Biotechnol Bioeng. 2006;94(5):938–48. - PubMed
Publication types
MeSH terms
Grants and funding
LinkOut - more resources
Full Text Sources
Other Literature Sources
Miscellaneous
