

Surface microbes in the neonatal intensive care unit: changes with routine cleaning and over time
- PMID: 23740726
- PMCID: PMC3719657
- DOI: 10.1128/JCM.00898-13
Surface microbes in the neonatal intensive care unit: changes with routine cleaning and over time
Abstract
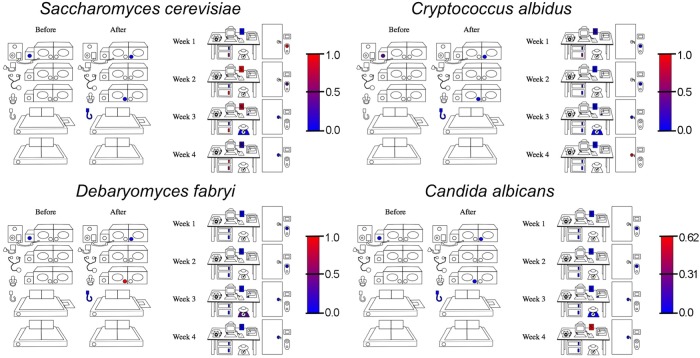
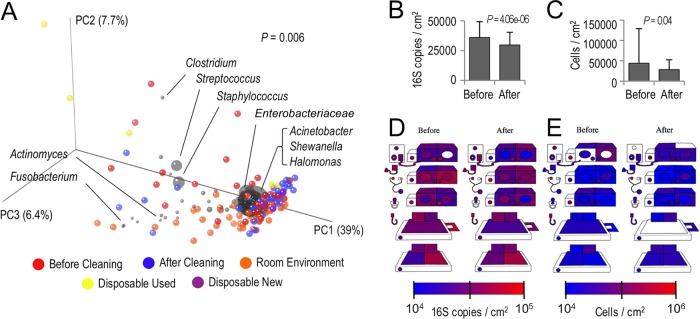
Premature infants in neonatal intensive care units (NICUs) are highly susceptible to infection due to the immaturity of their immune systems, and nosocomial infections are a significant risk factor for death and poor neurodevelopmental outcome in this population. To investigate the impact of cleaning within a NICU, a high-throughput short-amplicon-sequencing approach was used to profile bacterial and fungal surface communities before and after cleaning. Intensive cleaning of surfaces in contact with neonates decreased the total bacterial load and the percentage of Streptococcus species with similar trends for total fungal load and Staphylococcus species; this may have clinical relevance since staphylococci and streptococci are the most common causes of nosocomial NICU infections. Surfaces generally had low levels of other taxa containing species that commonly cause nosocomial infections (e.g., Enterobacteriaceae) that were not significantly altered with cleaning. Several opportunistic yeasts were detected in the NICU environment, demonstrating that these NICU surfaces represent a potential vector for spreading fungal pathogens. These results underline the importance of routine cleaning as a means of managing the microbial ecosystem of NICUs and of future opportunities to minimize exposures of vulnerable neonates to potential pathogens and to use amplicon-sequencing tools for microbial surveillance and hygienic testing in hospital environments.
Figures


References
-
- Melamed R, Greenberg D, Porat N, Karplus M, Zmora E, Golan A, Yagupsky P, Dagan R. 2003. Successful control of an Acinetobacter baumannii outbreak in a neonatal intensive care unit. J. Hosp. Infect. 53:31–38 - PubMed
-
- Shimono N, Hayashi J, Matsumoto H, Miyake N, Uchida Y, Shimoda S, Furusyo N, Akashi K. 2012. Vigorous cleaning and adequate ventilation are necessary to control an outbreak in a neonatal intensive care unit. J. Infect. Chemother. 18:303–307 - PubMed
-
- Chandrashekar MR, Rathish KC, Nagesha CN. 1997. Reservoirs of nosocomial pathogens in neonatal intensive care unit. J. Indian Med. Assoc. 95: 72–74, 77 - PubMed
-
- Newman MJ. 2002. Neonatal intensive care unit: reservoirs of nosocomial pathogens. West Afr. J. Med. 21:310–312 - PubMed
-
- Bures S, Fishbain JT, Uyehara CF, Parker JM, Berg BW. 2000. Computer keyboards and faucet handles as reservoirs of nosocomial pathogens in the intensive care unit. Am. J. Infect. Control 28:465–471 - PubMed
Publication types
MeSH terms
Grants and funding
LinkOut - more resources
Full Text Sources
Other Literature Sources
Medical
Molecular Biology Databases
