

Optimal combination of number of participants and number of repeated measurements in longitudinal studies with time-varying exposure
- PMID: 23740818
- PMCID: PMC3808503
- DOI: 10.1002/sim.5870
Optimal combination of number of participants and number of repeated measurements in longitudinal studies with time-varying exposure
Abstract
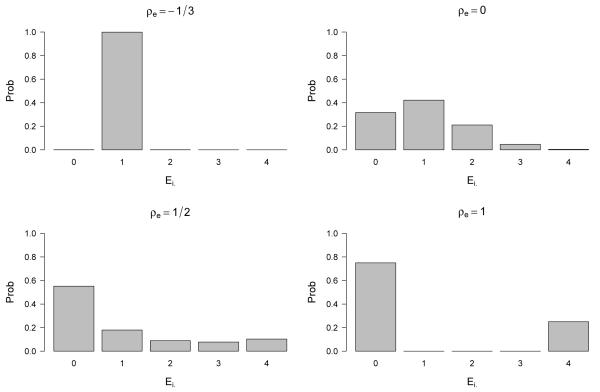
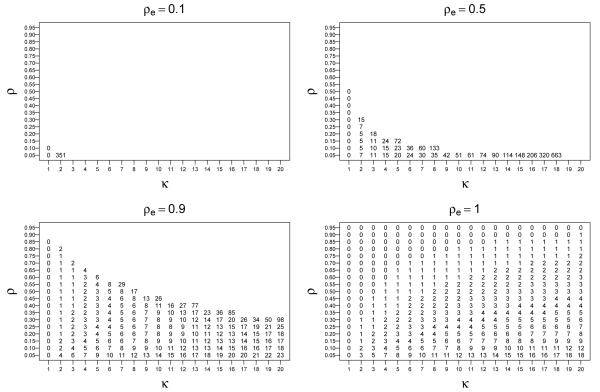
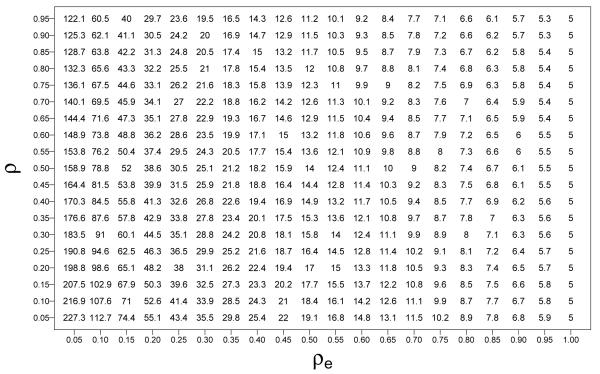
In the context of observational longitudinal studies, we explored the values of the number of participants and the number of repeated measurements that maximize the power to detect the hypothesized effect, given the total cost of the study. We considered two different models, one that assumes a transient effect of exposure and one that assumes a cumulative effect. Results were derived for a continuous response variable, whose covariance structure was assumed to be damped exponential, and a binary time-varying exposure. Under certain assumptions, we derived simple formulas for the approximate solution to the problem in the particular case in which the response covariance structure is assumed to be compound symmetry. Results showed the importance of the exposure intraclass correlation in determining the optimal combination of the number of participants and the number of repeated measurements, and therefore the optimized power. Thus, incorrectly assuming a time-invariant exposure leads to inefficient designs. We also analyzed the sensitivity of results to dropout, mis-specification of the response correlation structure, allowing a time-varying exposure prevalence and potential confounding impact. We illustrated some of these results in a real study. In addition, we provide software to perform all the calculations required to explore the combination of the number of participants and the number of repeated measurements.
Keywords: intraclass correlation; longitudinal study; optimal design; sample size.
Copyright © 2013 John Wiley & Sons, Ltd.
Figures
References
-
- Schlesselman JJ. Planning a longitudinal study. II. Frequency of measurement and study duration. Journal of Chronic Diseases. 1973;26(9):561–570. DOI:10.1016/0021-9681(73)90061-1. - PubMed
-
- Kirby AJ, Galai N, Muñoz A. Sample size estimation using repeated measurements on biomarkers as outcomes. Controlled Clinical Trials. 1994;15(3):165–172. DOI: 10.1016/0197-2456(94)90054-X. - PubMed
-
- Dawson JD. Sample size calculations based on slopes and other summary statistics. Biometrics. 1998;54(1):323–330. DOI:10.2307/2534019. - PubMed
Publication types
MeSH terms
Substances
Grants and funding
LinkOut - more resources
Full Text Sources
Other Literature Sources