. 2013 Sep;110(5):1130-43.
doi: 10.1152/jn.00167.2013. Epub 2013 Jun 5.

Physiological and anatomical properties of intramedullary projection neurons in rat rostral nucleus of the solitary tract

Affiliations

Physiological and anatomical properties of intramedullary projection neurons in rat rostral nucleus of the solitary tract

James A Corson et al. J Neurophysiol. 2013 Sep.

Abstract

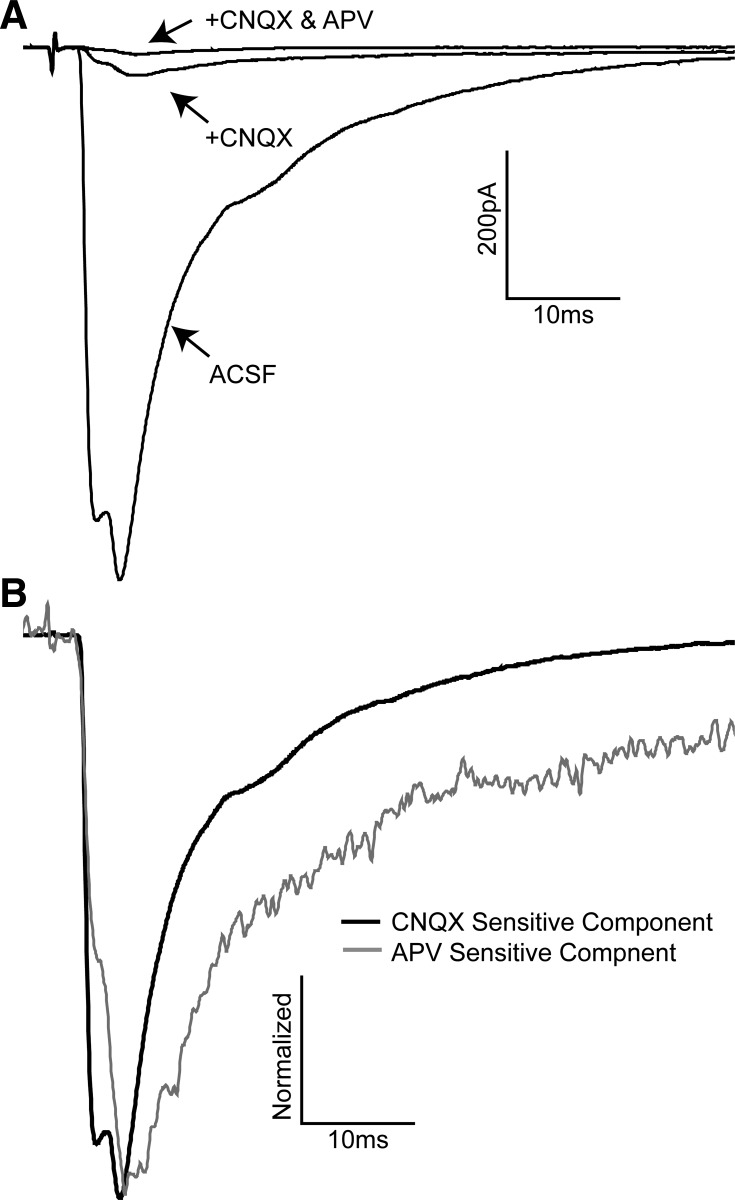
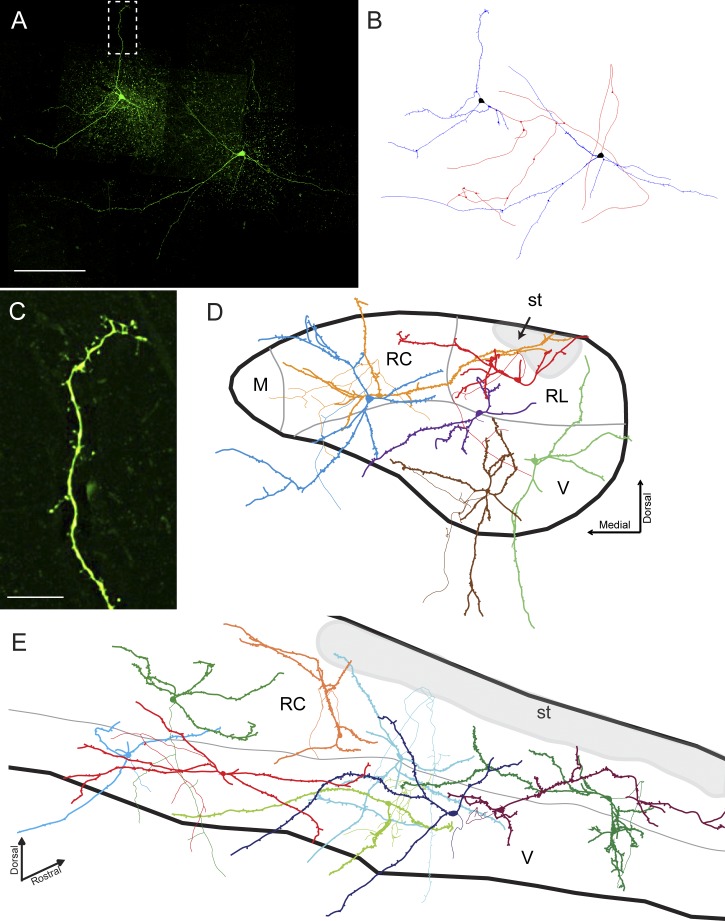
The rostral nucleus of the solitary tract (rNTS), the first-order relay of gustatory information, not only transmits sensory information to more rostral brain areas but also connects to various brain stem sites responsible for orofacial reflex activities. While much is known regarding ascending projections to the parabrachial nucleus, intramedullary projections to the reticular formation (which regulate oromotor reflexive behaviors) remain relatively unstudied. The present study examined the intrinsic firing properties of these neurons as well as their morphological properties and synaptic connectivity with primary sensory afferents. Using in vitro whole cell patch-clamp recording, we found that intramedullary projection neurons respond to depolarizing current injection with either tonic or bursting action potential trains and subsets of these groups of neurons express A-type potassium, H-like, and postinhibitory rebound currents. Approximately half of the intramedullary projection neurons tested received monosynaptic innervation from primary afferents, while the rest received polysynaptic innervation, indicating that at least a subpopulation of these neurons can be directly activated by incoming sensory information. Neuron morphological reconstructions revealed that many of these neurons possessed numerous dendritic spines and that neurons receiving monosynaptic primary afferent input have a greater spine density than those receiving polysynaptic primary afferent input. These results reveal that intramedullary projection neurons represent a heterogeneous class of rNTS neurons and, through both intrinsic voltage-gated ion channels and local circuit interactions, transform incoming gustatory information into signals governing oromotor reflexive behaviors.

Keywords: patch clamp; primary afferent; taste.


Figures

Fig. 1.
Fig. 1.
DiI injections in the subjacent reticular formation retrogradely label neurons in rostral nucleus of the solitary tract (rNTS). A: the injection site and micropipette tract are visualized with epifluorescent illumination, and the coronal brain stem section is visualized with differential interference contrast optics. B and C: neurons in both ipsilateral and contralateral rNTS are labeled after 48-h survival. Neurons are most densely localized in the rostral-central and ventral subdivisions, with sparser labeling in the rostral-lateral and medial subdivisions. D and E: labeled neuron somata as well as proximal dendrites were clearly identifiable after DiI labeling. Both multipolar (D) and elongate (E) neurons were retrogradely labeled. RL, rostral-lateral; RC, rostral-central; M, medial; V, ventral. Scale bars: 500 (A), 175 (B and C), and 20 (D and E) μm.
Fig. 2.
Fig. 2.
Repetitive firing patterns were examined with depolarizing current injection (100 pA for 1 s). A: the majority of neurons responded to current injection with a tonic train of action potentials that had a relatively constant amplitude and threshold. B: another group of neurons responded to current injection with a rapid burst of action potentials followed by a steady-state depolarization without spiking. Action potential amplitude rapidly decreased while threshold increased to reach this steady depolarization.
Fig. 3.
Fig. 3.
Intramedullary projection neurons express heterogeneous voltage-activated ion channels similar to other rNTS neuron populations. A: preceding a depolarizing current injection by a hyperpolarizing current injection induces either a delay in action potential firing (shown here, arrow) or a long first interspike interval following depolarizing current injection. B: voltage-clamp recording simulating the membrane potential change induced by the current injection in A shows that the this change in firing pattern is the result of an outward current (arrow) with a relatively slow decay. RMP, resting membrane potential. C: voltage-clamp recording from a neuron expressing an A-type potassium current (IKa) after depolarization to −50 mV from −110 mV. ACSF, artificial cerebrospinal fluid. D: addition of 4-aminopyridine (4-AP; a selective IKa blocker) results in an elimination of this outward current. E: arithmetic subtraction of the traces in C and D shows the 4-AP-sensitive current, an outward current with a relatively slow decay.
Fig. 4.
Fig. 4.
Postinhibitory rebound current (IPIR) and Ih are also expressed in some intramedullary projection neurons. A: in some neurons, the release of a hyperpolarizing current injection initiates a rebound spiking (arrow). B: voltage-clamp recording simulating the change in membrane potential demonstrating that a fast inward current (arrow) causes this postinhibitory rebound. C: during hyperpolarizing current injection, a subset of neurons displayed prominent membrane sag (arrow) that increased with current injection magnitude. This neuron also displayed a postinhibitory rebound. D: voltage-clamp recording shows that a delayed inward current (arrow), similar to the Ih previously reported, causes this membrane sag. Note that neurons often expressed multiple combinations of these 3 voltage-activated ion channels and that the combination expressed shows no relation to repetitive firing pattern.
Fig. 5.
Fig. 5.
A parasagittal plane of section was used to examine the synaptic connectivity between primary afferents and intramedullary projection neurons. A: a parasagittal rNTS slice preparation (as depicted by the gray shaded regions) combines the benefits of the horizontal and coronal planes of section. The width of the gray shaded region in both diagrams is 400 μm (the thickness of the in vitro preparations). B: myelin staining of a 50-μm parasagittal section reveals that both the solitary tract (arrowheads) as well as the multiple subdivisions can be visualized in the same plane. Rostral-caudal traversing myelinated fiber bundles provide a demarcation for the ventral subdivision, while the dorsal-ventral myelinated bundles and myelin-sparse regions demarcate the rostral-central subdivision. C: fluorescently labeled chorda tympani nerve terminal field photomicrographs were overlaid onto the myelin-stained photomicrograph in B. Note that these images are from the same section (see methods), allowing for exact registration of terminal field and NTS architecture. Scale bar in B: 1 mm.
Fig. 6.
Fig. 6.
Solitary tract stimulation evoked both monosynaptic and polysynaptic responses in intramedullary projection neurons. A: synaptic responses were classified as monosynaptic if they displayed a jitter value < 300 μs as measured from 10 separate stimulations (10 individual stimulations overlaid here). B: synaptic responses with jitter values > 300 μs were classified as polysynaptic. The amplitudes of these responses varied greatly between individual stimulations and also displayed a high failure rate. C: synaptic latency and jitter were positively correlated (P < 0.05), with longer latencies more often displaying increased jitter.
Fig. 7.
Fig. 7.
Monosynaptic primary afferent synapses responded to increasing stimulus current intensity with unitary, stepwise increases in postsynaptic current amplitude. A: stimulus current intensity increases from 10 to 400 μA resulted in corresponding increases in postsynaptic current amplitude. Note that increases in postsynaptic current amplitude did not alter synaptic latency. Arrow marks stimulus artifact. B: stepwise increases in postsynaptic current amplitude can be seen with increasing stimulus current intensities, indicative of unitary synaptic input. Each step increase likely represents the recruitment of additional primary afferent fibers. Postsynaptic currents do not increase beyond 200-μA stimulating current.
Fig. 8.
Fig. 8.
Primary afferent synapses responded to repetitive stimulation with frequency-dependent depression. A: average traces (over 10 repeated stimulation series) depict the degree of frequency-dependent depression. Timescales have been normalized to align each set of 5 stimulations. B: the first and second stimulations from A have been expanded to show the decrease in amplitude of the second evoked postsynaptic current (PSC) relative to the first. C: increasing the stimulation frequency from 5 to 50 Hz results in a corresponding increase in the magnitude of synaptic depression.
Fig. 9.
Fig. 9.
Primary afferent synaptic connections with intramedullary projection neurons are primarily AMPAergic. A: bath application of the selective AMPA antagonist 6-cyano-7-nitroquinoxaline-2,3-dione (CNQX) blocks the majority of the postsynaptic current, leaving a much smaller current that can be blocked with subsequent addition of the selective NMDA antagonist dl-2-amino-5-phosphonopentanoic acid (APV). Traces are the average of 10 consecutive trials. B: isolation of the CNQX- and APV-sensitive components of the postsynaptic current through arithmetic subtraction reveals that the APV-sensitive component has slower rise and decay time compared with the CNQX-sensitive component, consistent with NMDA receptor kinetics.
Fig. 10.
Fig. 10.
Intramedullary projection neurons respond to solitary tract stimulation with initial excitation followed by inhibition. A: neurons were held at −110 mV to +20 mV in 10-mV increments while solitary tract-evoked postsynaptic currents were recorded. Holding currents were subtracted to obtain postsynaptic currents relative to a standard baseline. B: the same traces plotted in a heat map demonstrate that at depolarized holding potentials the initial inward current is no longer present and the latter postsynaptic current reverses into an outward current. Each recording trace is separated into 1-ms bins and the data averaged within each bin. The resulting postsynaptic current (relative to a 100-ms baseline obtained prior to stimulation) was color coded by intensity, with warm colors (yellow and red) representing outward currents and cool colors (blues) representing inward currents. The strongest outward currents do not occur until 20 ms after stimulation (15 ms after the initial postsynaptic current). C: Current-voltage (I-V) curves showing the reversal potentials of postsynaptic currents at 2 time points in the traces (6 ms and 8 ms after tract stimulation). Data are fitted with Boltzmann equation curves. This again demonstrates that the initial postsynaptic response (at 6 ms) does not reverse until membrane potentials above 0 mV, indicative of excitation. The latter portion of the response (at 8 ms) reverses at approximately −55 mV, indicative of predominantly inhibition.
Fig. 11.
Fig. 11.
Neurons were filled with Lucifer yellow during recording and the morphologies reconstructed. A: 2 neurons recorded in the same rNTS slice visualized in a composite of multiple z-stacks (max intensity projections) stitched together. B: the morphology of both neurons is traced and reconstructed showing both the axonal (red) and dendritic (blue) morphologies. C: higher-magnification z-stack (max intensity projection) of the boxed region in A shows that the dendrites are spiny, a characteristic rarely observed in other rNTS neuronal populations. D: reconstructed neuronal morphologies from multiple coronal rNTS slices placed onto a prototypical rNTS coronal section show that dendrites and axonal collaterals cross subdivision boundaries. Intramedullary projection neuron dendrites and axons also extend into the subjacent reticular formation. Each neuron is pseudocolored differently to aid in visualization. Dendrites are depicted as thick lines and axons as thinner lines of the same color. E: reconstructed neuronal morphologies from multiple parasagittal rNTS slices placed onto a prototypical rNTS parasagittal section show that dendrites can extend long distances along the rostrocaudal rNTS axis.
Fig. 12.
Fig. 12.
Of all morphological parameters examined, only spine density showed any relationship to the physiological properties. Each box plot shows the mean as the horizontal line, 1 standard deviation above and below the mean in the box, the 95% confidence interval in the bars, and data outside of the 95% confidence interval as individual markers. A: there were no differences in spine density between neurons grouped according to their repetitive firing patterns. B: however, neurons that responded to a hyperpolarizing pulse preceding depolarization with a delay in firing had a greater spine density than those that had no change. C: likewise, neurons that expressed IKa had a greater spine density than those that did not express such a current, but there was no difference in spine density for neurons expressing either Ih or IPIR (D and E, respectively). F: neurons that responded to solitary tract stimulation with monosynaptic currents had a greater spine density than those that responded with polysynaptic currents. *P < 0.05, **P < 0.01.

References

    1. Bao H, Bradley RM, Mistretta CM. Development of intrinsic electrophysiological properties in neurons from the gustatory region of rat nucleus of solitary tract. Brain Res Dev Brain Res 86: 143–154, 1995 - PubMed
    1. Barreiro AK, Thilo EL, Shea-Brown E. A-current and type I/type II transition determine collective spiking from common input. J Neurophysiol 108: 1631–1645, 2012 - PMC - PubMed
    1. Beckman ME, Whitehead MC. Intramedullary connections of the rostral nucleus of the solitary tract in the hamster. Brain Res 557: 265–279, 1991 - PubMed
    1. Boxwell AJ, Yanagawa Y, Travers SP, Travers JB. The mu-opioid receptor agonist DAMGO presynaptically suppresses solitary tract-evoked input to neurons in the rostral solitary nucleus. J Neurophysiol 109: 2815–2826, 2013 - PMC - PubMed
    1. Bradley RM, Mistretta CM. The gustatory sense in foetal sheep during the last third of gestation. J Physiol 231: 271–282, 1973 - PMC - PubMed

Publication types

LinkOut - more resources