

Quantifying species diversity with a DNA barcoding-based method: Tibetan moth species (Noctuidae) on the Qinghai-Tibetan Plateau
- PMID: 23741330
- PMCID: PMC3669328
- DOI: 10.1371/journal.pone.0064428
Quantifying species diversity with a DNA barcoding-based method: Tibetan moth species (Noctuidae) on the Qinghai-Tibetan Plateau
Abstract
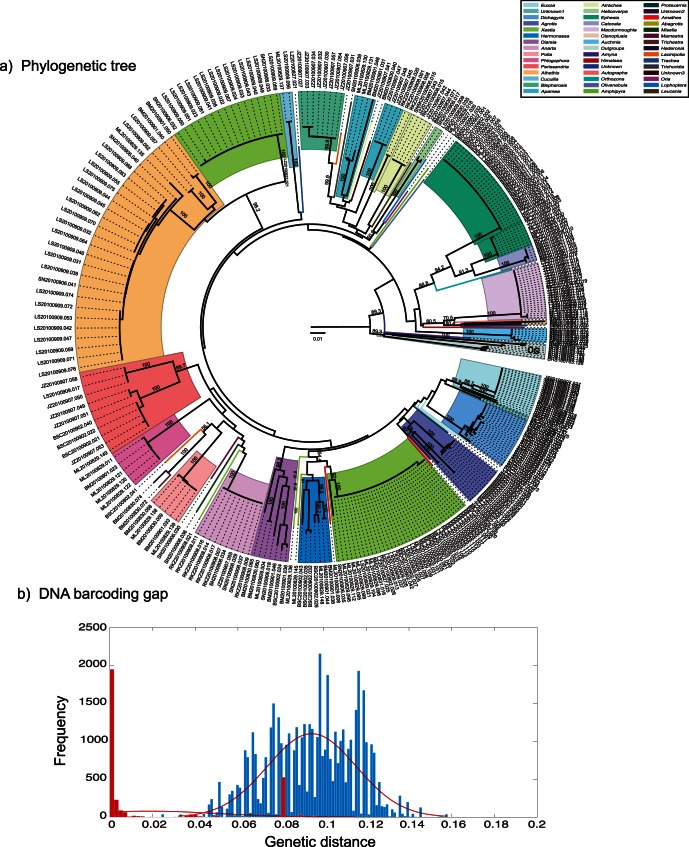
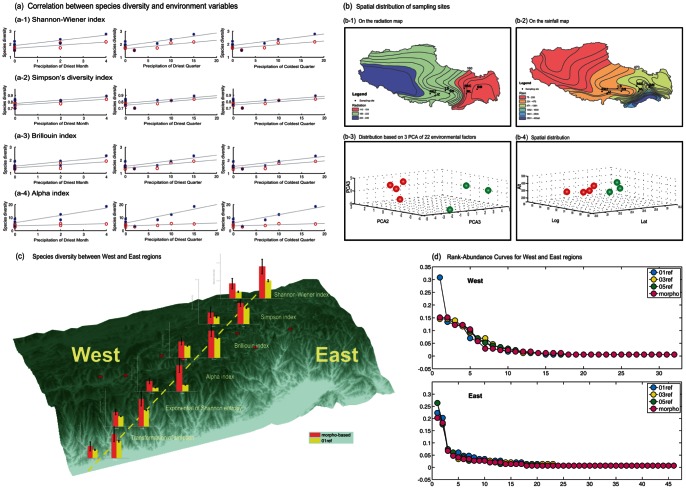
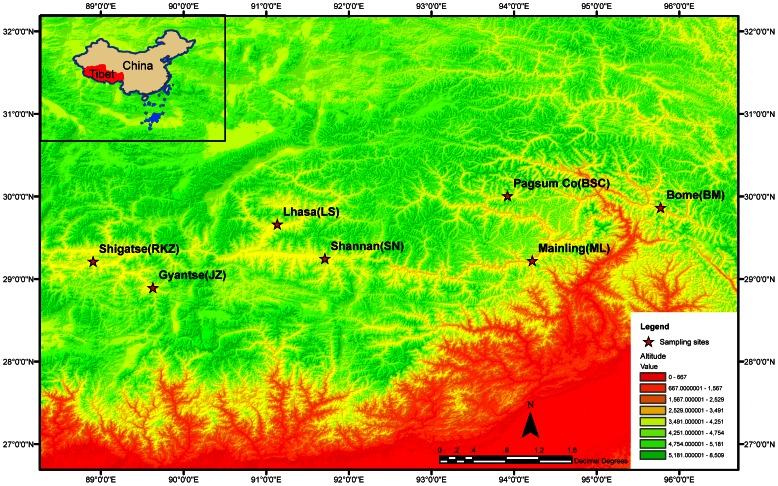
With the ongoing loss of biodiversity, there is a great need for fast and effective ways to assess species richness and diversity: DNA barcoding provides a powerful new tool for this. We investigated this approach by focusing on the Tibetan plateau, which is one of the world's top biodiversity hotspots. There have been few studies of its invertebrates, although they constitute the vast majority of the region's diversity. Here we investigated species diversity of the lepidopteran family Noctuidae, across different environmental gradients, using measurements based on traditional morphology as well as on DNA barcoding. The COI barcode showed an average interspecific K2P distance of 9.45±2.08%, which is about four times larger than the mean intraspecific distance (1.85±3.20%). Using six diversity indices, we did not detect any significant differences in estimated species diversity between measurements based on traditional morphology and on DNA barcoding. Furthermore, we found strong positive correlations between them, indicating that barcode-based measures of species diversity can serve as a good surrogate for morphology-based measures in most situations tested. Eastern communities were found to have significantly higher diversity than Western ones. Among 22 environmental factors tested, we found that three (precipitation of driest month, precipitation of driest quarter, and precipitation of coldest quarter) were significantly correlated with species diversity. Our results indicate that these factors could be the key ecological factors influencing the species diversity of the lepidopteran family Noctuidae on the Tibetan plateau.
Conflict of interest statement
Figures
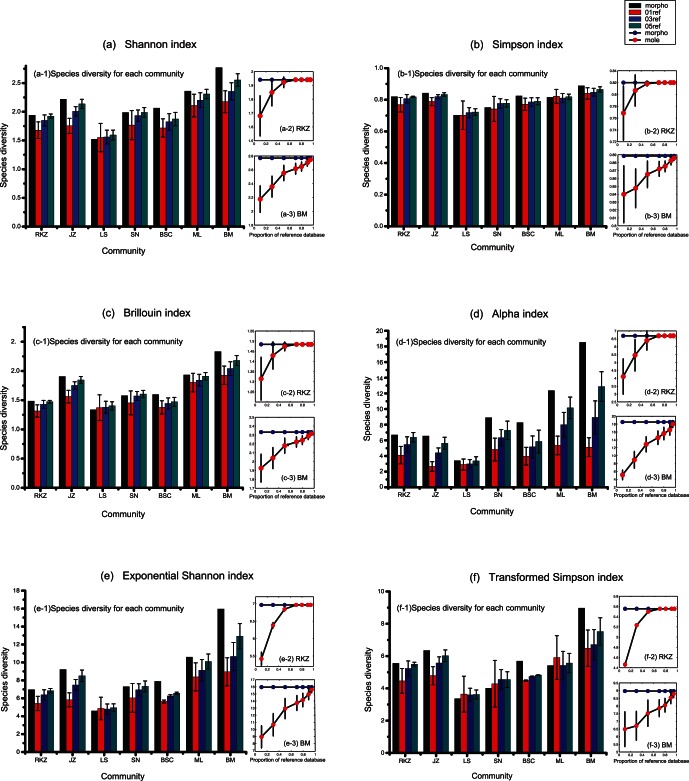
 index; (e) Exponential Shannon index; (f) Transformed Simpson index.
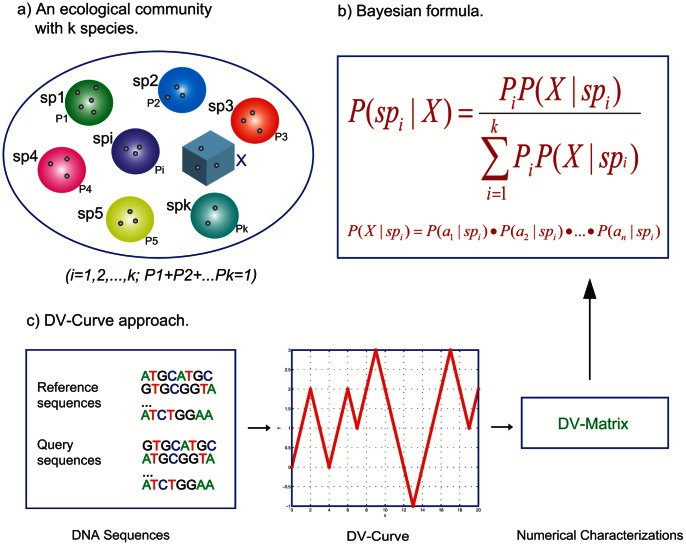
 is the
  th species in the community,
  is an unknown sample with DNA sequenced,
  is the probability of a sample belonging to
  .
.  is the conditional probability of the unknown sample
  belonging to
  given that its DNA is sequenced.
  is the probability of having DNA sequence of the unknown sample
  given that DNA sequences of
  are known.
Similar articles
-
DNA barcoding reveals cryptic diversity in the underestimated genus Triplophysa (Cypriniformes: Cobitidae, Nemacheilinae) from the northeastern Qinghai-Tibet Plateau.BMC Evol Biol. 2020 Nov 12;20(1):151. doi: 10.1186/s12862-020-01718-0. BMC Evol Biol. 2020. PMID: 33183225 Free PMC article.
-
Characterization and comparison of poorly known moth communities through DNA barcoding in two Afrotropical environments in Gabon 1.Genome. 2019 Mar;62(3):96-107. doi: 10.1139/gen-2018-0063. Epub 2018 Oct 2. Genome. 2019. PMID: 30278147
-
Fast Census of Moth Diversity in the Neotropics: A Comparison of Field-Assigned Morphospecies and DNA Barcoding in Tiger Moths.PLoS One. 2016 Feb 9;11(2):e0148423. doi: 10.1371/journal.pone.0148423. eCollection 2016. PLoS One. 2016. PMID: 26859488 Free PMC article.
-
Performance of DNA metabarcoding, standard barcoding and morphological approaches in the identification of insect biodiversity.Mol Ecol Resour. 2024 Nov;24(8):e14018. doi: 10.1111/1755-0998.14018. Epub 2024 Sep 16. Mol Ecol Resour. 2024. PMID: 39285627
-
Services of DNA barcoding in different fields.Mitochondrial DNA A DNA Mapp Seq Anal. 2016 Nov;27(6):4463-4474. doi: 10.3109/19401736.2015.1089572. Epub 2015 Oct 16. Mitochondrial DNA A DNA Mapp Seq Anal. 2016. PMID: 26470942 Review.
Cited by
-
Systematics and biology of some species of Micrurapteryx Spuler (Lepidoptera, Gracillariidae) from the Holarctic Region, with re-description of M. caraganella (Hering) from Siberia.Zookeys. 2016 Apr 11;(579):99-156. doi: 10.3897/zookeys.579.7166. eCollection 2016. Zookeys. 2016. PMID: 27110203 Free PMC article.
-
A two-step DNA barcoding approach for delimiting moth species: moths of Dongling Mountain (Beijing, China) as a case study.Sci Rep. 2018 Sep 24;8(1):14256. doi: 10.1038/s41598-018-32123-9. Sci Rep. 2018. PMID: 30250036 Free PMC article.
References
-
- Magurran A (1988) Ecological Diversi492 ty and Its Measurement. Princeton University Press, 1st edition, 179.
-
- Cabaret J, Schmidt E (2001) Species diversity of nematode communities in the digestive tract of domestic ruminants: multivariate versus univariate estimations. Parasitol Res 87: 311–6. - PubMed
-
- Jost L (2006) Entropy and diversity. Oikos 113: 363–375.
-
- Jost L (2007) Partitioning diversity into independent alpha and beta components. Ecology 88: 2427–2439. - PubMed
-
- Jost L (2008) Gst and its relatives do not measure differentiation. Mol Ecol 17: 4015–4026. - PubMed
Publication types
MeSH terms
Substances
LinkOut - more resources
Full Text Sources
Other Literature Sources
