

Community flux balance analysis for microbial consortia at balanced growth
- PMID: 23741341
- PMCID: PMC3669319
- DOI: 10.1371/journal.pone.0064567
Community flux balance analysis for microbial consortia at balanced growth
Abstract
A central focus in studies of microbial communities is the elucidation of the relationships between genotype, phenotype, and dynamic community structure. Here, we present a new computational method called community flux balance analysis (cFBA) to study the metabolic behavior of microbial communities. cFBA integrates the comprehensive metabolic capacities of individual microorganisms in terms of (genome-scale) stoichiometric models of metabolism, and the metabolic interactions between species in the community and abiotic processes. In addition, cFBA considers constraints deriving from reaction stoichiometry, reaction thermodynamics, and the ecosystem. cFBA predicts for communities at balanced growth the maximal community growth rate, the required rates of metabolic reactions within and between microbes and the relative species abundances. In order to predict species abundances and metabolic activities at the optimal community growth rate, a nonlinear optimization problem needs to be solved. We outline the methodology of cFBA and illustrate the approach with two examples of microbial communities. These examples illustrate two useful applications of cFBA. Firstly, cFBA can be used to study how specific biochemical limitations in reaction capacities cause different types of metabolic limitations that microbial consortia can encounter. In silico variations of those maximal capacities allow for a global view of the consortium responses to various metabolic and environmental constraints. Secondly, cFBA is very useful for comparing the performance of different metabolic cross-feeding strategies to either find one that agrees with experimental data or one that is most efficient for the community of microorganisms.
Conflict of interest statement
Figures
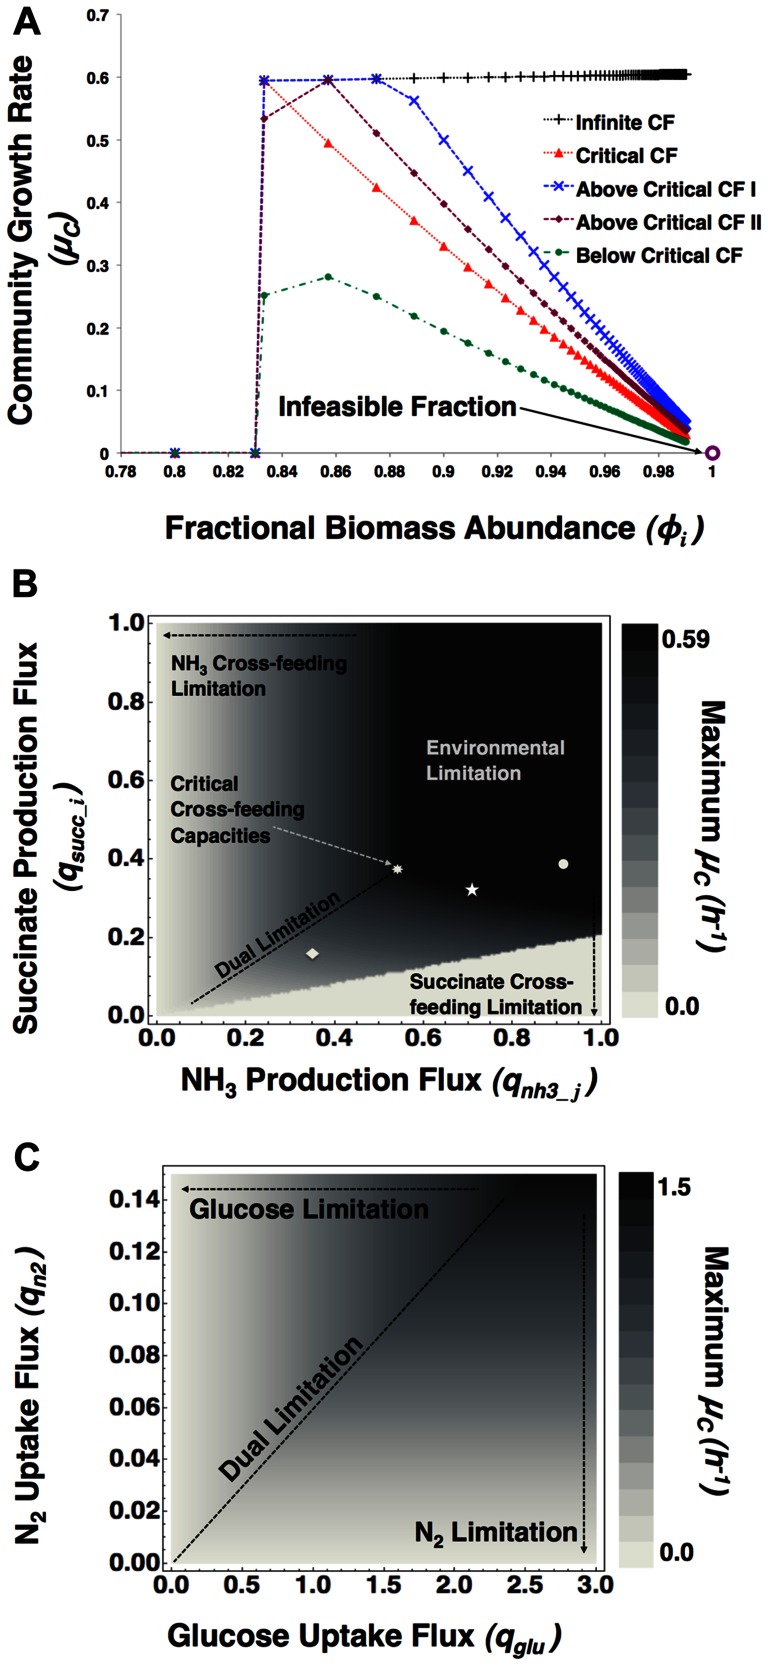
 ), in h−1, as a function of fractional biomass abundance of species
  (
( ) at different cross-feeding (CF) reaction capacities, with all
  ’s in mol•h−
1 and all
’s in mol•h−
1 and all  ’s in mol•g−1•h−
1. We consider a limited glucose (flux:
’s in mol•g−1•h−
1. We consider a limited glucose (flux:  and excess nitrogen (flux:
  and vary the flux bounds for CF fluxes (i.e. succinate (
 ) and ammonia (
 ) production fluxes) to distinguish different limitation regimes and optimality states: i. infinite CF when, ii. critical CF (
 ), iii. two cases for above critical CF: curve I (for:
 and curve II (for:
  , and iv. below critical CF (for:
  . This figure indicates that the CF reactions determine the optimal value of the community growth rate and the optimal fractional biomass abundance. B: A contour plot is generated for the optimal community growth rate
  as function of the upper bound of the succinate production flux by species
  and the ammonia production flux of species
  . The environmental conditions are the same as in Figure 2A. The different points depict the various cross-feeding regimes distinguished in Figure 2A (• Above Critical CF – I, ★ Above Critical CF – II, ♦Below Critical CF). This figure indicates that the CF fluxes between the organisms determine the optimal community state at a fixed environment. C: Contour plot of the maximum community growth rate
 , as a function of the environment while cross-feeding capacities are kept unconstrained. This figure indicates that the optimal state of the ecosystem can be determined by specific environmental fluxes.
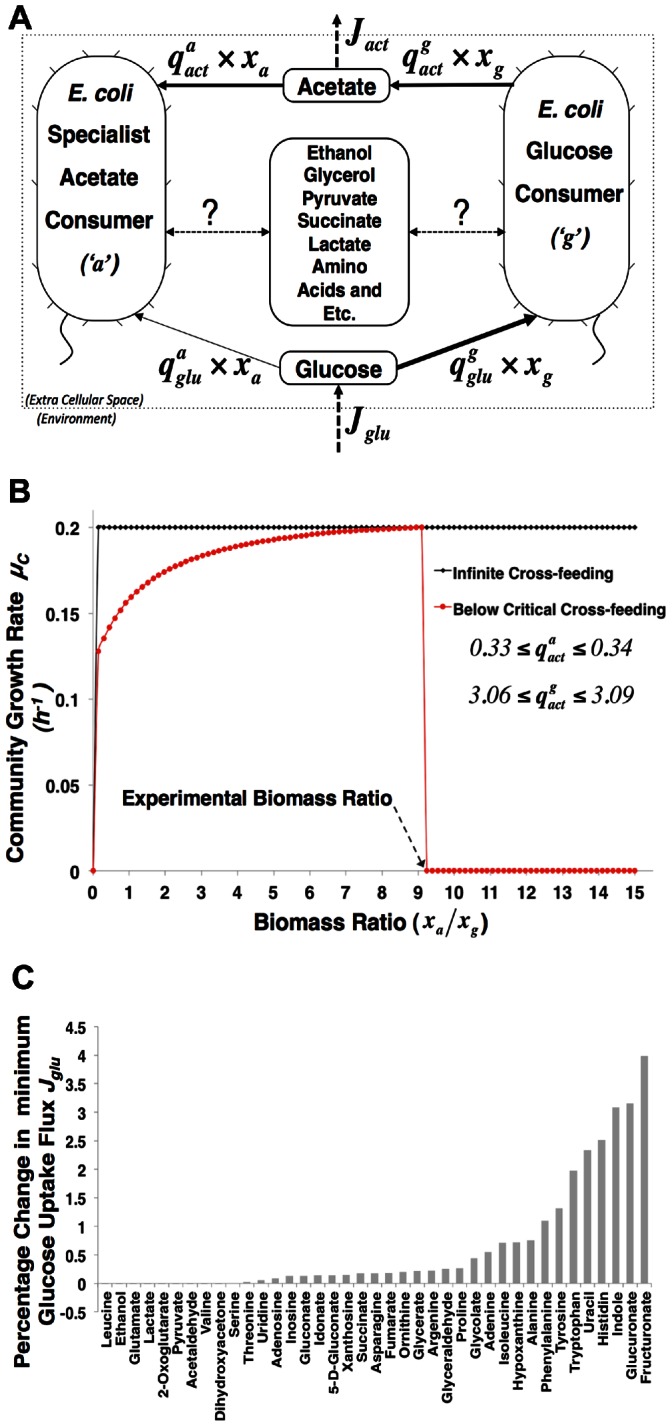
 ’ and other is a specialist acetate consumer ‘
 ’. They both take up glucose with specific glucose consumption fluxes
  and
and  in mmol•g−1•h−
1 but ‘
in mmol•g−1•h−
1 but ‘ ’ does this with lower activity than ‘
 ’. Strain ‘
 ’ produces acetate with flux
  and strain ‘
 ’ consumes it via flux
  . In the chemostat, glucose is provided at a constant rate
  . And
. And is the acetate production rate (mol•h−
1). Various metabolites could be cross-fed between both organisms besides acetate, which leads to the question whether those alternative metabolites can be predicted by cFBA. B: A biomass ratio scan was performed and the community growth rate
is the acetate production rate (mol•h−
1). Various metabolites could be cross-fed between both organisms besides acetate, which leads to the question whether those alternative metabolites can be predicted by cFBA. B: A biomass ratio scan was performed and the community growth rate  is plotted as a function of the steady-state biomass ratio. The following parameter were determined from the experimental data of Rosenzweig et al. (1994):
 ;
;  ; dilution rate (D) =
  = 0.2; and steady state biomass ratio
  . To plot the ‘Below Critical Cross-feeding’ curve, cross-feeding fluxes were constrained as indicated in the plot, while for the ‘Infinite Cross-feeding” curve, unconstrained acetate cross-feeding capacities were assumed. C: Percentage change in minimum glucose uptake rate
  needed to achieve the growth rate
  of 0.2 h−
1 for alternative cross-feeding metabolites (one-at-a-time).
of 0.2 h−
1 for alternative cross-feeding metabolites (one-at-a-time).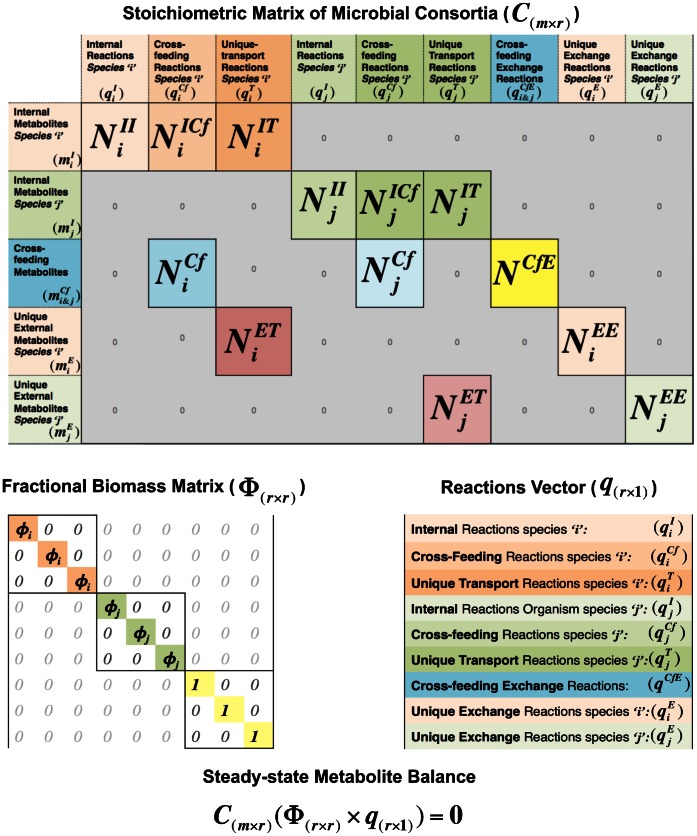
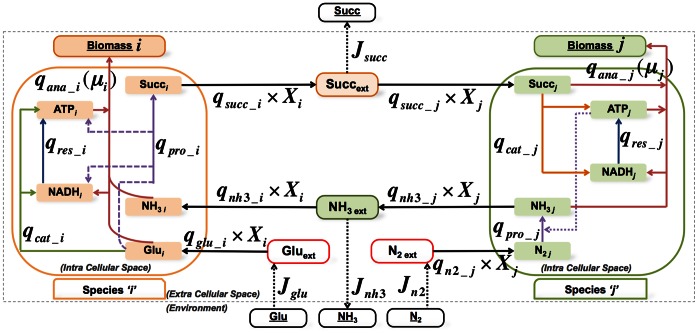
 has
has  rows (metabolites) and
  columns (reactions) and is created by merging individual stoichiometric matrices (
 ,
, ) of community microorganisms and the environmental fluxes. The species-specific stoichiometric matrices have a consistent organization of metabolites (intracellular (
 ), cross-feeding (
 ) and extracellular (
 )) and reactions (intracellular (
 ), cross-feeding (
 ), unique transport (
 ) and environmental exchange (
 )). Any sub-matrix notation has species name (
 or
or  ) as subscript and type of metabolites and reactions as superscript. The community stoichiometry matrix multiplied by the fractional biomass matrix
  and flux vector
  then gives the steady state mass balances of the community (equation (3)).
References
-
- Follows MJ, Dutkiewicz S, Grant S, Chisholm SW (2007) Emergent biogeography of microbial communities in a model ocean. Science 315: 1843–1846. - PubMed
-
- Ley RE, Turnbaugh PJ, Klein S, Gordon JI (2006) Microbial ecology: human gut microbes associated with obesity. Nature 444: 1022–1023. - PubMed
-
- Fuhrman JA (2009) Microbial community structure and its functional implications. Nature 459: 193–199. - PubMed
-
- Röling WFM, Ferrer M, Golyshin PN (2010) Systems approaches to microbial communities and their functioning. Curr Opin in Biotechnol 21: 532–538. - PubMed
-
- Borenstein E (2012) Computational systems biology and in silico modeling of the human microbiome. Briefings in Bioinformatics 13: 769–780. - PubMed
Publication types
MeSH terms
LinkOut - more resources
Full Text Sources
Other Literature Sources
