

Robust automated detection of microstructural white matter degeneration in Alzheimer's disease using machine learning classification of multicenter DTI data
- PMID: 23741425
- PMCID: PMC3669206
- DOI: 10.1371/journal.pone.0064925
Robust automated detection of microstructural white matter degeneration in Alzheimer's disease using machine learning classification of multicenter DTI data
Abstract
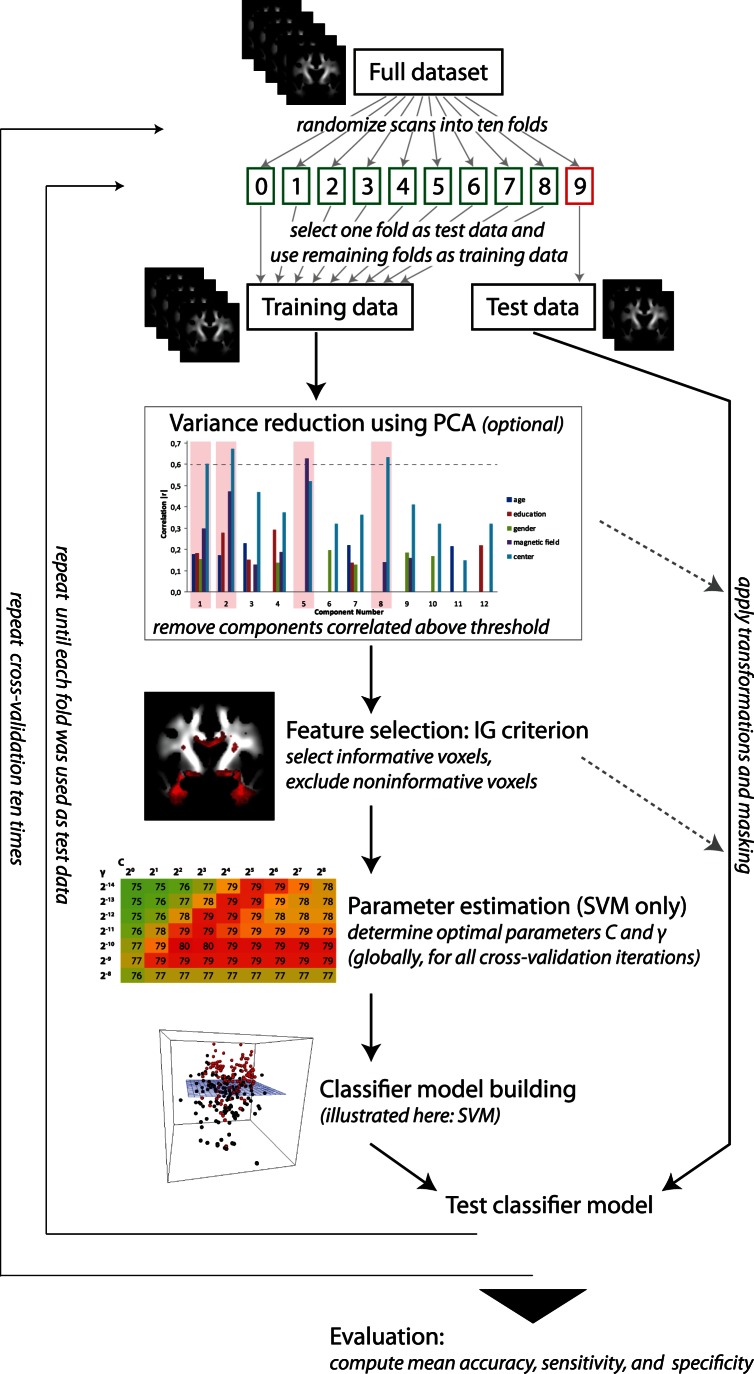
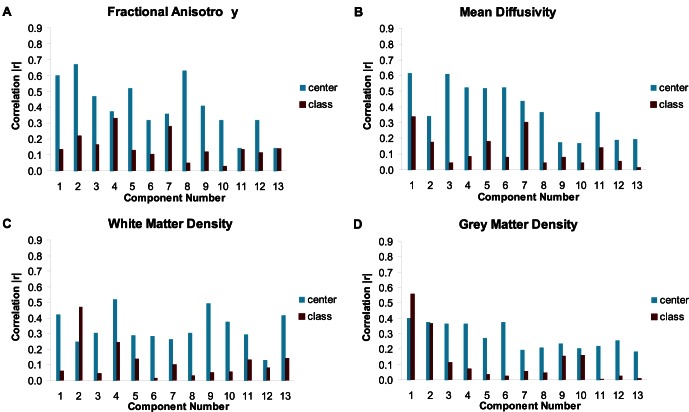
Diffusion tensor imaging (DTI) based assessment of white matter fiber tract integrity can support the diagnosis of Alzheimer's disease (AD). The use of DTI as a biomarker, however, depends on its applicability in a multicenter setting accounting for effects of different MRI scanners. We applied multivariate machine learning (ML) to a large multicenter sample from the recently created framework of the European DTI study on Dementia (EDSD). We hypothesized that ML approaches may amend effects of multicenter acquisition. We included a sample of 137 patients with clinically probable AD (MMSE 20.6±5.3) and 143 healthy elderly controls, scanned in nine different scanners. For diagnostic classification we used the DTI indices fractional anisotropy (FA) and mean diffusivity (MD) and, for comparison, gray matter and white matter density maps from anatomical MRI. Data were classified using a Support Vector Machine (SVM) and a Naïve Bayes (NB) classifier. We used two cross-validation approaches, (i) test and training samples randomly drawn from the entire data set (pooled cross-validation) and (ii) data from each scanner as test set, and the data from the remaining scanners as training set (scanner-specific cross-validation). In the pooled cross-validation, SVM achieved an accuracy of 80% for FA and 83% for MD. Accuracies for NB were significantly lower, ranging between 68% and 75%. Removing variance components arising from scanners using principal component analysis did not significantly change the classification results for both classifiers. For the scanner-specific cross-validation, the classification accuracy was reduced for both SVM and NB. After mean correction, classification accuracy reached a level comparable to the results obtained from the pooled cross-validation. Our findings support the notion that machine learning classification allows robust classification of DTI data sets arising from multiple scanners, even if a new data set comes from a scanner that was not part of the training sample.
Conflict of interest statement
Figures
References
-
- Dubois B, Feldman HH, Jacova C, DeKosky ST, Barberger-Gateau P, et al. (2007) Research criteria for the diagnosis of Alzheimer’s disease: revising the NINCDS–ADRDA criteria. The Lancet Neurology 6: 734–746. - PubMed
-
- Roher AE, Weiss N, Kokjohn TA, Kuo Y-M, Kalback W, et al. (2002) Increased Aβ Peptides and Reduced Cholesterol and Myelin Proteins Characterize White Matter Degeneration in Alzheimer’s Disease. Biochemistry 41: 11080–11090. - PubMed
-
- Neil JJ (2008) Diffusion imaging concepts for clinicians. J Magn Reson Imaging 27: 1–7. - PubMed
-
- Takagi T, Nakamura M, Yamada M, Hikishima K, Momoshima S, et al. (2009) Visualization of peripheral nerve degeneration and regeneration: Monitoring with diffusion tensor tractography. NeuroImage 44: 884–892. - PubMed
Publication types
MeSH terms
LinkOut - more resources
Full Text Sources
Other Literature Sources
Medical
