. 2013 May 31;8(5):e65614.
doi: 10.1371/journal.pone.0065614. Print 2013.

Latent transforming growth factor β-binding protein 4 is downregulated in esophageal cancer via promoter methylation

Affiliations

Latent transforming growth factor β-binding protein 4 is downregulated in esophageal cancer via promoter methylation

Insa Bultmann et al. PLoS One. .

Abstract

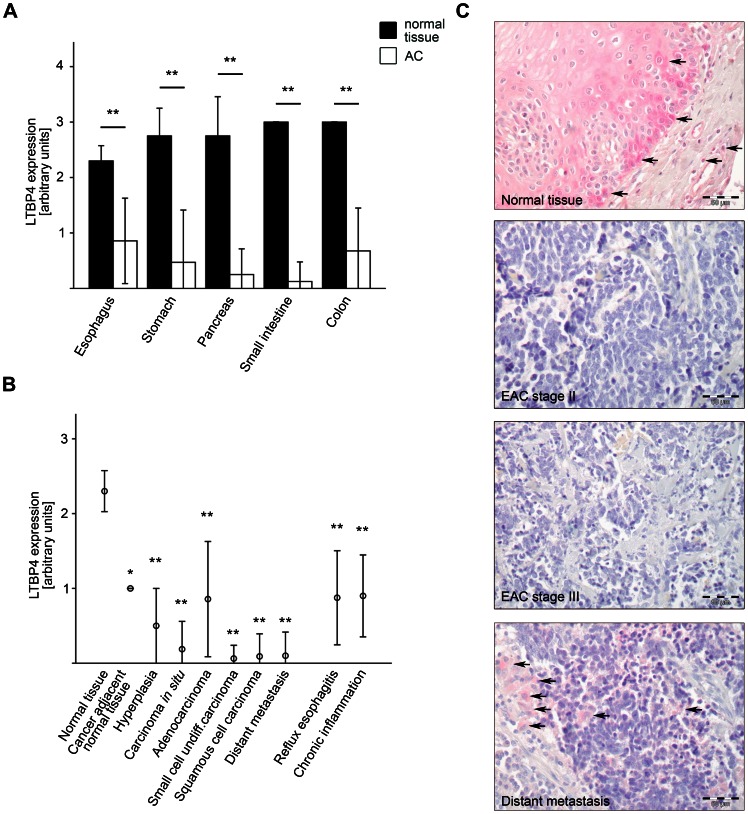
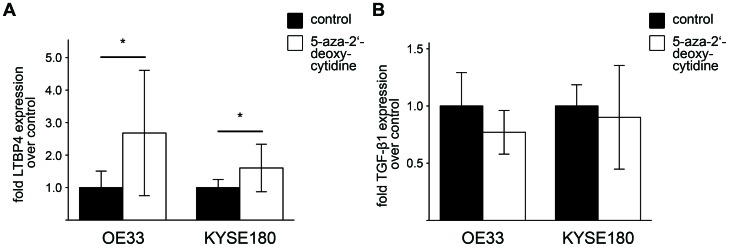
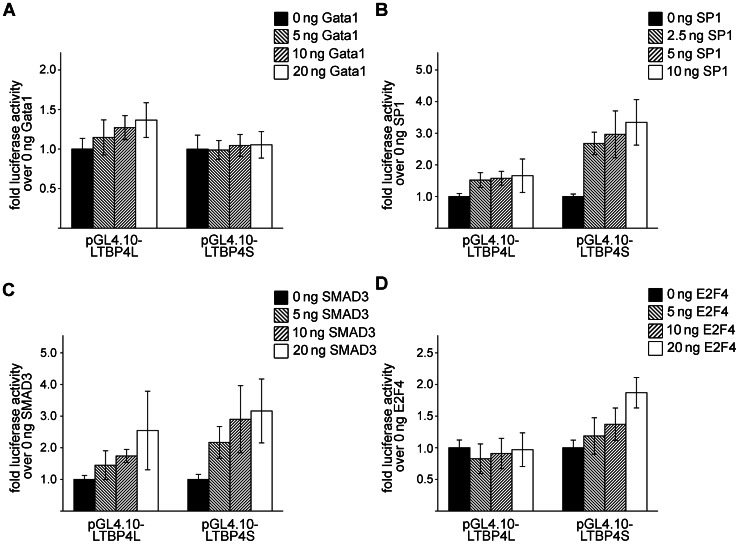
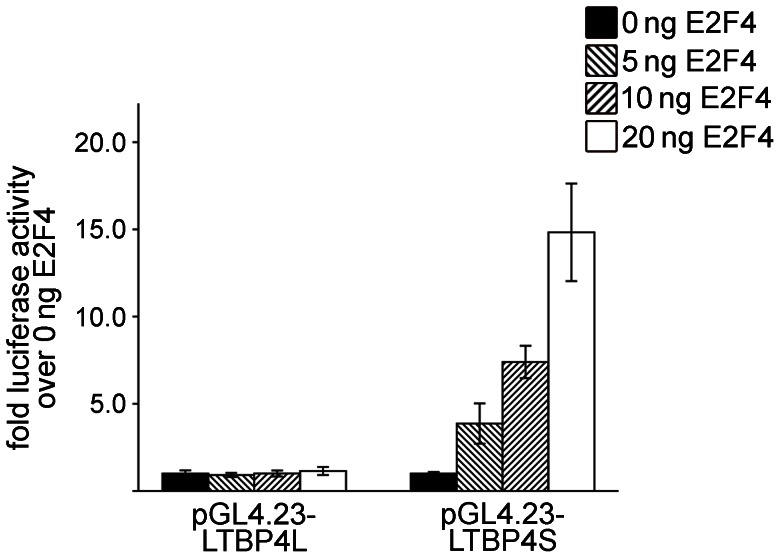
Latent transforming growth factor β-binding protein 4 (LTBP4) is an extracellular matrix molecule that is a member of important connective tissue networks and is needed for the correct folding and the secretion of TGF-β1. LTBP4 is downregulated in carcinomas of various tissues. Here we show that LTBP4 is also downregulated in adenocarcinomas and squamous cell carcinomas of the esophagus in vitro and in vivo. Re-expression of LTBP4 in esophageal cancer cell lines reduced cell migration ability, whereas cell viability and cell proliferation remained unchanged. Hypermethylation of the promoter regions of the two main human LTBP4 transcriptional forms, LTBP4L and LTBP4S, was found to be involved in LTBP4 silencing. Detailed investigations of the methylation patterns of the promoter regions of LTBP4L and LTBP4S identified GATA1, SP1, E2F4 and SMAD3 as potential transcription factors involved in LTBP4 expression. In in vitro transcription factor activity studies we discovered E2F4 as novel powerful regulator for LTBP4S expression.


Conflict of interest statement

Competing Interests: The authors have declared that no competing interests exist.

Figures

Figure 1
Figure 1. LTBP4 is downregulated in gastrointestinal cancer.
A) LTBP4 protein expression levels were assessed by immunohistochemistry in tissue microarrays of patient adenocarcinomas (AC) of esophagus, stomach, pancreas, small intestine and colon compared to normal tissue of the same organ. B) LTBP4 protein expression levels were assessed by immunohistochemistry in patient tissues of esophageal cancer progression compared to normal esophageal tissues in tissue microarrays. C) Immunohistochemical evaluation of LTBP4 expression in normal esophagus, esophageal adenocarcinoma (EAC) stage II, EAC stage III and in a distant lymph node metastasis. Black arrows indicate LTBP4-positive staining. Data are presented ± standard deviation and *p<0.05, **p<0.01 versus normal tissue. Bar graphs: 50 µm.
Figure 2
Figure 2. Re-expression of LTBP4 leads to less migration ability of esophageal carcinoma cells.
A) Migration distance of OE33 and in KYSE180 cells after transient transfection with either pcDNA6 as a control or pcDNA6-LTBP4 within 24 h. Experiments were repeated at least 3 times. The symbols represent the results of each individual experiment and the graphs document the respective mean values. Significances are given: #p = n.s. and *p<0.05. B) Representative immunofluorescence staining of the migration assay performed with KYSE180 cells re-expressing LTBP4. LTBP4 (green) and c-myc (red) positive cells (yellow) defined the borders of the cell free gap. Only non-transfected cells migrated into the cell free gap. Nuclei were counterstained with DAPI (blue). The arrow indicates the migration direction. Bar graph: 50 µm.
Figure 3
Figure 3. Demethylation treatment with 5-aza-2’-deoxycytidine induces LTBP4 expression, whereas TGF-β1 expression is not changed.
A) qPCR analysis showed induction of LTBP4 expression in OE33 and KYSE180 cells after demethylation treatment with 5-aza-2’-deoxycytidine. B) qPCR analysis showed no significant changes in TGF-β1 expression in OE33 and KYSE180 cells after demethylation treatment with 5-aza-2’-deoxycytidine. Untreated cells served as control. Experiments were repeated at least 3 times and the mean value was calculated. Data are presented ± standard deviation and *p<0.05 versus control.
Figure 4
Figure 4. Methylation status of the two predicted LTBP4 promoter regions in esophageal carcinoma cell lines.
The methylation status in the putative LTBP4 promoter regions was analyzed by clonal bisulfite sequencing in OE33 and KYSE180 cells. Eight CpG islands were identified and at least ten clones were sequenced for each cell line. The percentage of methylation in each CpG island is visualized as pie chart. Exons are illustrated by black boxes and LTBP4 promoters by red lines. The translation start sites are indicated (ATG). The dashed lines represent alternative splicing of LTBP4.
Figure 5
Figure 5. Identification of highly methylated binding sites for transcription factors in the LTBP4L and LTBP4S promoter.
In silico analysis of LTBP4 promoter sites identified a highly methylated binding site for GATA1 in the LTBP4L promoter of OE33 and KYSE180 cells. Highly methylated binding sites for SP1 and E2F4 are found in the LTBP4S promoter of both cell lines. A binding site for SMAD3 was identified nearby. The methylation status was analyzed by clonal bisulfite sequencing and at least ten clones were sequenced for each cell line. The percentage of methylation is visualized as pie chart. Exons are illustrated by black boxes and LTBP4S and LTBP4L promoters by red lines. The translation start sites are indicated (ATG). The dashed lines represent alternative splicing of LTBP4.
Figure 6
Figure 6. Effect of Gata1, SP1, SMAD3 and E2F4 on transcriptional activity of LTBP4L and LTBP4S promoter.
HEK293 cells were transiently transfected with pGL4.10-LTBP4L or pGL4.10-LTBP4S and a Renilla luciferase expression vector for normalization. Cells were also co-transfected with different concentrations of A) a Gata1 expression vector, B) a SP1 expression vector, C) a SMAD3 expression vector or D) an E2F4 expression vector. After 24 h cells were lysed and luciferase activities were determined. Experiments were repeated at least 3 times and the mean value was calculated. Data are presented ± standard deviation.
Figure 7
Figure 7. E2F4 acts as a potent regulator of LTBP4S expression in combination with other regulatory elements.
HEK293 cells were transiently transfected with pGL4.23-LTBP4L or pGL4.23-LTBP4S and a Renilla luciferase expression vector for normalization. Cells were also co-transfected with different concentrations of an E2F4 expression vector. After 24 h cells were lysed and luciferase activities were determined. Experiments were repeated at least 3 times and the mean value was calculated. Data are presented ± standard deviation.

References

    1. Ferlay J, Shin HR, Bray F, Forman D, Mathers C, et al. (2010) Estimates of worldwide burden of cancer in 2008: GLOBOCAN 2008. Int J Cancer 127: 2893–2917. - PubMed
    1. Siegel R, DeSantis C, Virgo K, Stein K, Mariotto A, et al. (2012) Cancer treatment and survivorship statistics, 2012. CA Cancer J Clin 62: 220–241. - PubMed
    1. Gavin AT, Francisci S, Foschi R, Donnelly DW, Lemmens V, et al... (2012) Oesophageal cancer survival in Europe: A EUROCARE-4 study. Cancer Epidemiol. - PubMed
    1. Holmes RS, Vaughan TL (2007) Epidemiology and pathogenesis of esophageal cancer. Semin Radiat Oncol 17: 2–9. - PubMed
    1. Groblewska M, Siewko M, Mroczko B, Szmitkowski M (2012) The role of matrix metalloproteinases (MMPs) and their inhibitors (TIMPs) in the development of esophageal cancer. Folia Histochem Cytobiol 50: 12–19. - PubMed

Publication types

MeSH terms