

Evidence that transcription factor AP-2γ is not required for Oct4 repression in mouse blastocysts
- PMID: 23741512
- PMCID: PMC3669238
- DOI: 10.1371/journal.pone.0065771
Evidence that transcription factor AP-2γ is not required for Oct4 repression in mouse blastocysts
Abstract
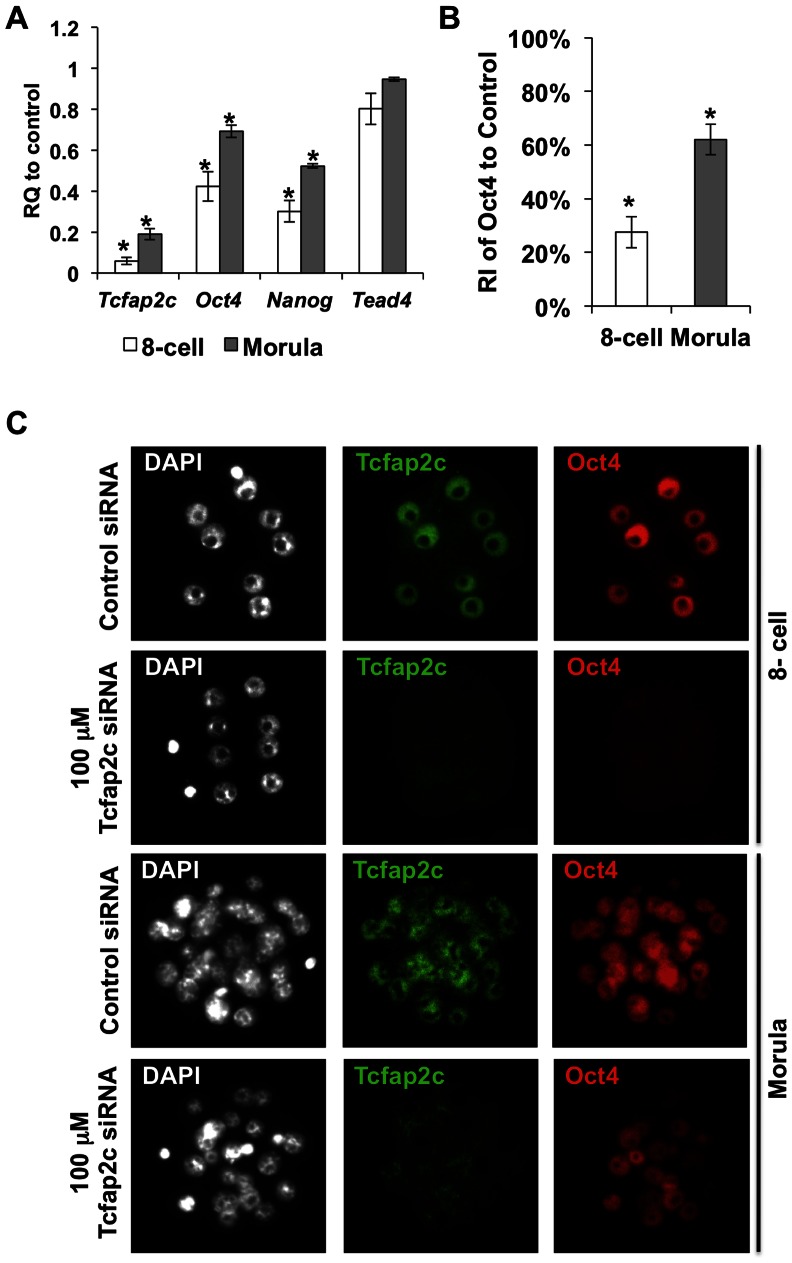
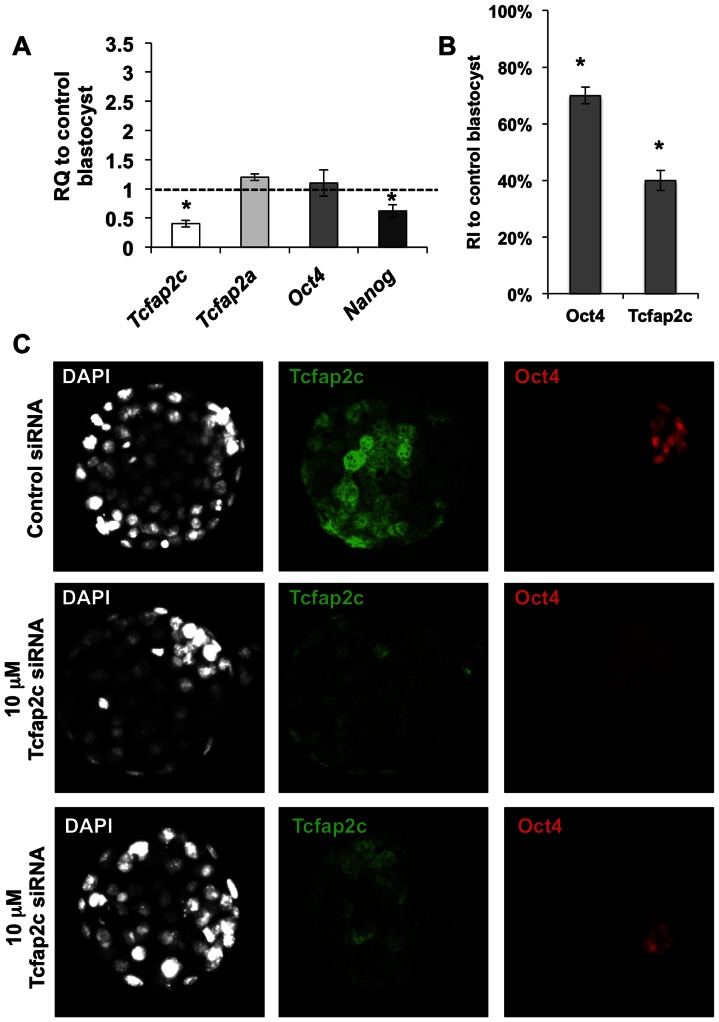
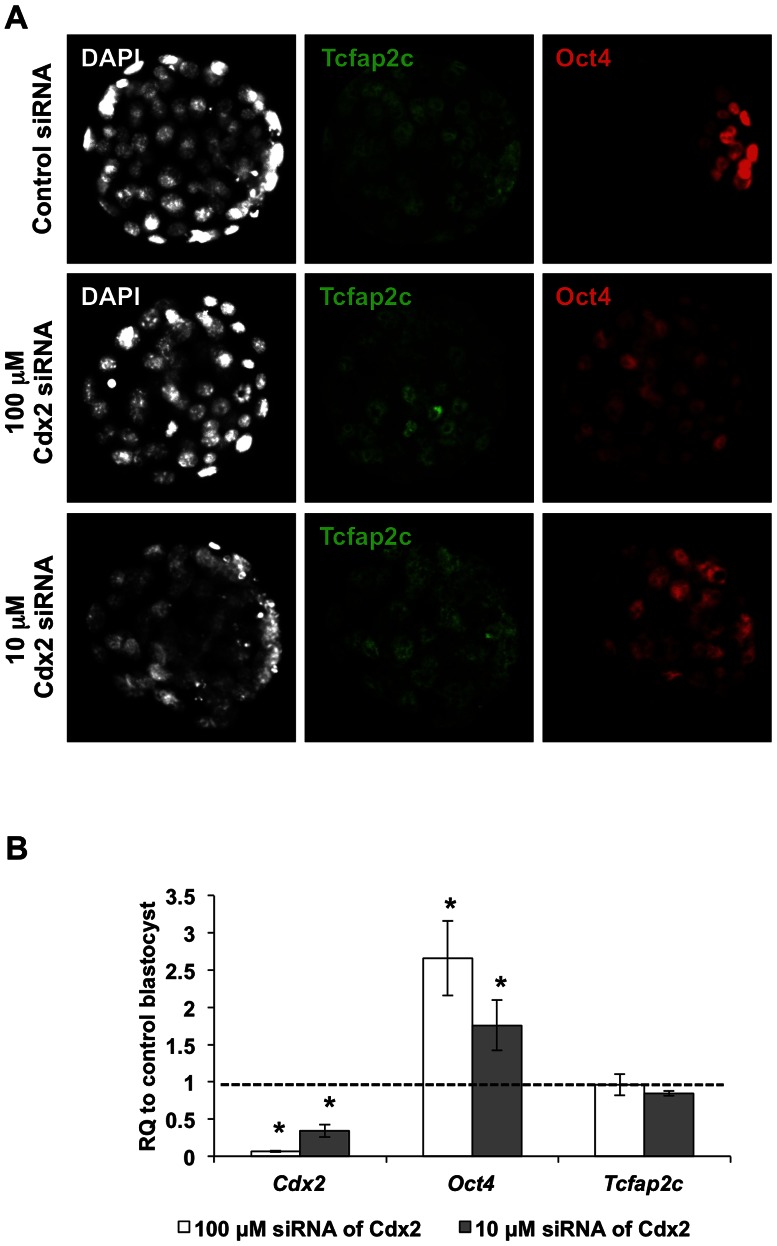
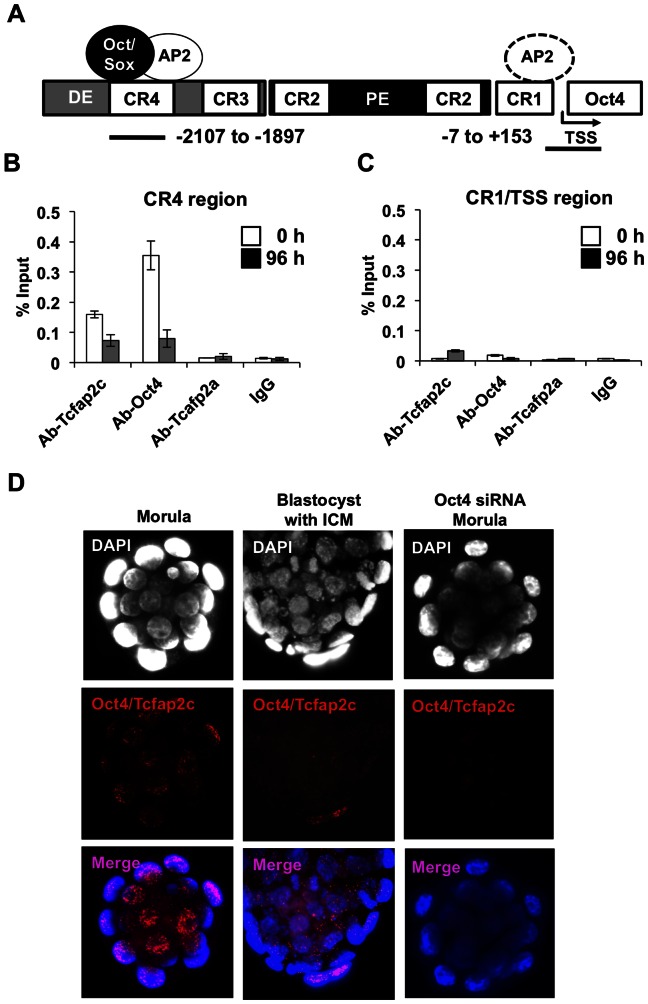
In mouse blastocysts segregation of the inner cell mass (ICM) and the trophectoderm (TE) is regulated by the mutually antagonistic effects of the transcription factors Oct4 and Cdx2 expressed in the ICM and TE, respectively. In contrast, in other species such as bovine and human, Oct4 is not restricted to the ICM and continues to be expressed in the Cdx2-positive TE. A recent comparative study of the bovine and mouse Oct4 promoters revealed that additional mechanisms might act in conjunction with Cdx2 to downregulate Oct4 expression in the mouse TE lineage. For instance, the mouse Oct4 distal enhancer contains an AP-2γ (Tcfap2c) binding motif that is absent in the bovine and human Oct4 distal enhancer. Nonetheless, the functional relevance of Tcfap2c in Oct4 repression during mouse preimplantation development was not tested. To elucidate the role of Tcfap2c in Oct4 expression an RNA interference approach was utilized. Depletion of Tcfap2c triggered a decrease in Oct4 expression at the 8-cell and morula stage. Remarkably, at the blastocyst stage depletion of Tcfap2c and/or its family member Tcfap2a had no effect on Oct4 repression. To test whether Tcfap2c interacts with Oct4 to positively regulate Oct4 expression, chromatin immunoprecipitation and in situ co-immunoprecipitation analyses were performed. These experiments revealed Tcfap2c and Oct4 binding were enriched at the Oct4 distal enhancer in embryonic stem (ES) cells, but were rapidly lost during differentiation into trophoblast-like cells when Oct4 became repressed. Moreover, Tcfap2c and Oct4 interactions were detected at the morula stage, but were lost during blastocyst formation. In summary, these data demonstrate that Tcfap2c is not required for Oct4 silencing in mouse blastocysts, but may be necessary for the maintenance of Oct4 expression during the 8 cell-to-morula transition. These findings support the notion Cdx2 is the predominant negative regulator of Oct4 expression during blastocyst formation in mice.
Conflict of interest statement
Figures
Similar articles
-
Epigenetic control of cell fate in mouse blastocysts: the role of covalent histone modifications and chromatin remodeling.Mol Reprod Dev. 2014 Feb;81(2):171-82. doi: 10.1002/mrd.22219. Epub 2013 Aug 13. Mol Reprod Dev. 2014. PMID: 23893501 Free PMC article. Review.
-
Brg1 is required for Cdx2-mediated repression of Oct4 expression in mouse blastocysts.PLoS One. 2010 May 12;5(5):e10622. doi: 10.1371/journal.pone.0010622. PLoS One. 2010. PMID: 20485553 Free PMC article.
-
Transcription factor AP-2γ is a core regulator of tight junction biogenesis and cavity formation during mouse early embryogenesis.Development. 2012 Dec;139(24):4623-32. doi: 10.1242/dev.086645. Development. 2012. PMID: 23136388 Free PMC article.
-
The transcription factor TCFAP2C/AP-2gamma cooperates with CDX2 to maintain trophectoderm formation.Mol Cell Biol. 2010 Jul;30(13):3310-20. doi: 10.1128/MCB.01215-09. Epub 2010 Apr 19. Mol Cell Biol. 2010. PMID: 20404091 Free PMC article.
-
Roles of cell differentiation factors in preimplantation development of domestic animals.J Reprod Dev. 2021 Jun 21;67(3):161-165. doi: 10.1262/jrd.2021-031. Epub 2021 Apr 27. J Reprod Dev. 2021. PMID: 33907058 Free PMC article. Review.
Cited by
-
Epigenetic control of cell fate in mouse blastocysts: the role of covalent histone modifications and chromatin remodeling.Mol Reprod Dev. 2014 Feb;81(2):171-82. doi: 10.1002/mrd.22219. Epub 2013 Aug 13. Mol Reprod Dev. 2014. PMID: 23893501 Free PMC article. Review.
-
Tead4 and Tfap2c generate bipotency and a bistable switch in totipotent embryos to promote robust lineage diversification.Nat Struct Mol Biol. 2024 Jun;31(6):964-976. doi: 10.1038/s41594-024-01311-9. Epub 2024 May 24. Nat Struct Mol Biol. 2024. PMID: 38789684 Free PMC article.
-
Retinoic Acid Induces Embryonic Stem Cell Differentiation by Altering Both Encoding RNA and microRNA Expression.PLoS One. 2015 Jul 10;10(7):e0132566. doi: 10.1371/journal.pone.0132566. eCollection 2015. PLoS One. 2015. PMID: 26162091 Free PMC article.
-
Deciphering the role of cis-regulatory elements and TFAP2C in the activation of zygotic Sox2 expression in mouse preimplantation embryos.Development. 2025 Jul 15;152(14):dev204626. doi: 10.1242/dev.204626. Epub 2025 Jul 18. Development. 2025. PMID: 40600821 Free PMC article.
-
Does TFAP2C govern conflicting cell fates in mouse preimplantation embryos?Reproduction. 2024 Feb 21;167(4):e230440. doi: 10.1530/REP-23-0440. Print 2024 Apr 1. Reproduction. 2024. PMID: 38165360 Free PMC article.
References
-
- Rossant J, Tam PPL (2009) Blastocyst lineage formation, early embryonic asymmetries and axis patterning in the mouse. Development 136: 701–713. - PubMed
-
- Takaoka K, Hamada H (2012) Cell fate decisions and axis determination in the early mouse embryo. Development 139: 3–14. - PubMed
-
- Niwa H, Toyooka Y, Shimosato D, Strumpf D, Takahashi K, et al. (2005) Interaction between Oct3/4 and Cdx2 Determines Trophectoderm Differentiation. Cell 123: 917–929. - PubMed
-
- Palmieri SL, Peter W, Hess H, Schöler HR (1994) Oct-4 Transcription Factor Is Differentially Expressed in the Mouse Embryo during Establishment of the First Two Extraembryonic Cell Lineages Involved in Implantation. Developmental Biology 166: 259–267. - PubMed
Publication types
MeSH terms
Substances
Grants and funding
LinkOut - more resources
Full Text Sources
Other Literature Sources
Molecular Biology Databases
