. 2013 May 31;8(5):e65977.
doi: 10.1371/journal.pone.0065977. Print 2013.

Endolymphatic Na⁺ and K⁺ concentrations during cochlear growth and enlargement in mice lacking Slc26a4/pendrin

Affiliations

Endolymphatic Na⁺ and K⁺ concentrations during cochlear growth and enlargement in mice lacking Slc26a4/pendrin

Xiangming Li et al. PLoS One. .

Abstract

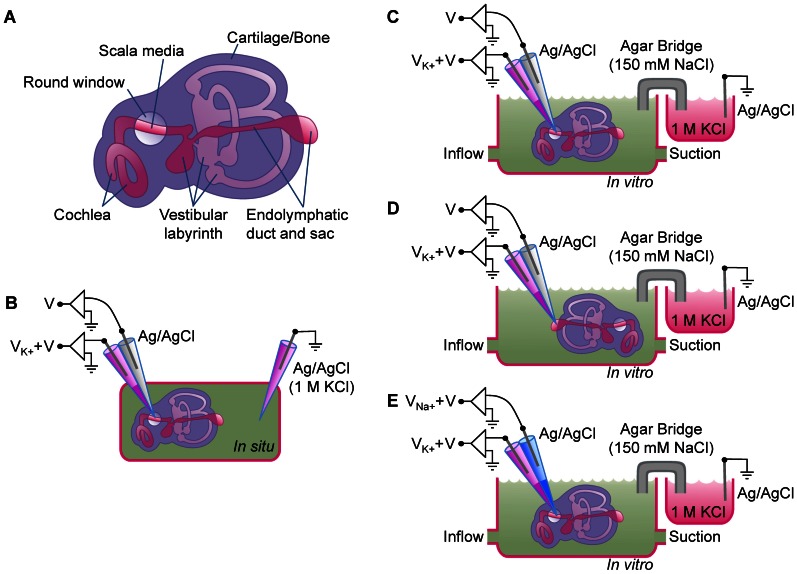
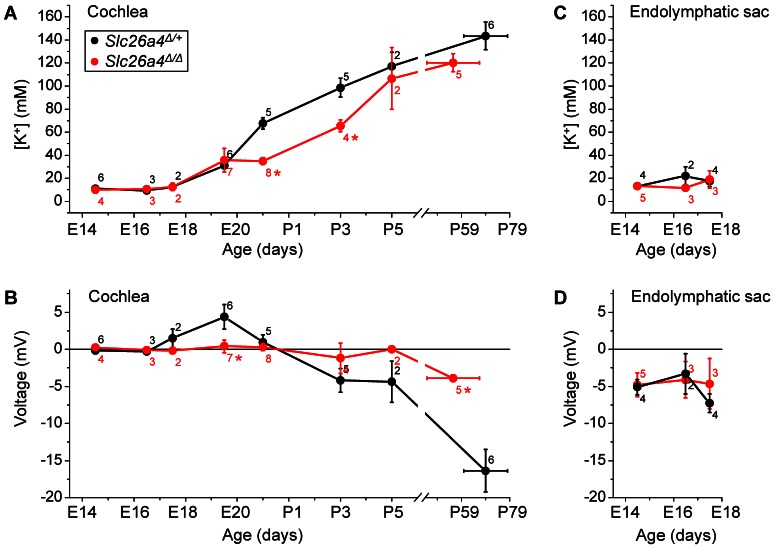
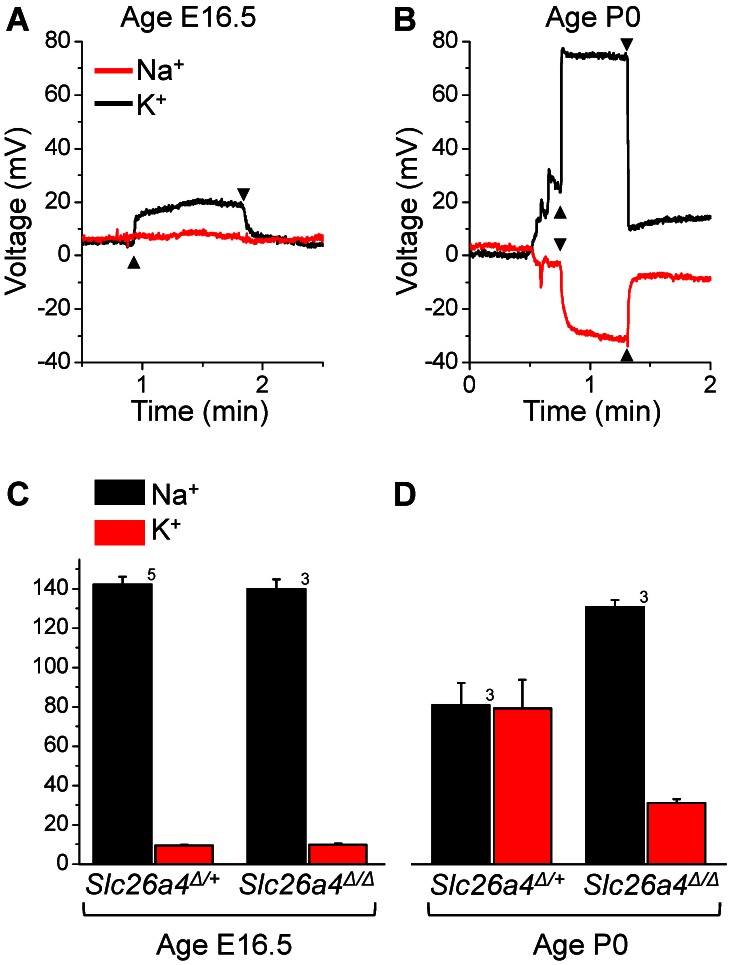
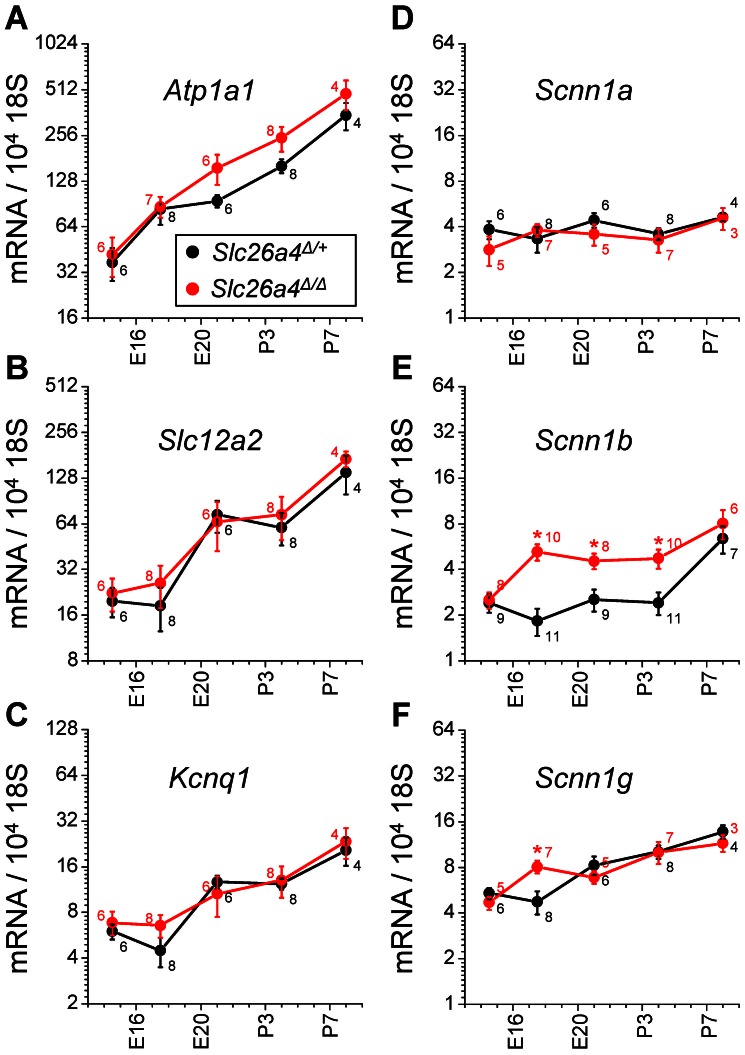
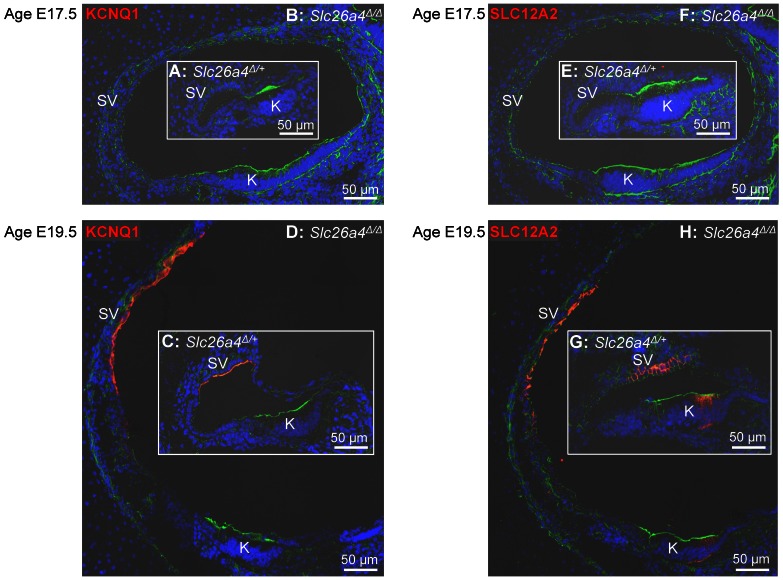
Slc26a4 (Δ/Δ) mice are deaf, develop an enlarged membranous labyrinth, and thereby largely resemble the human phenotype where mutations of SLC26A4 cause an enlarged vestibular aqueduct and sensorineural hearing loss. The enlargement is likely caused by abnormal ion and fluid transport during the time of embryonic development, however, neither the mechanisms of ion transport nor the ionic composition of the luminal fluid during this time of development are known. Here we determine the ionic composition of inner ear fluids at the time at which the enlargement develops and the onset of expression of selected ion transporters. Concentrations of Na(+) and K(+) were measured with double-barreled ion-selective electrodes in the cochlea and the endolymphatic sac of Slc26a4 (Δ/+), which develop normal hearing, and of Slc26a4 (Δ/Δ) mice, which fail to develop hearing. The expression of specific ion transporters was examined by quantitative RT-PCR and immunohistochemistry. High Na(+) (∼141 mM) and low K(+) concentrations (∼11 mM) were found at embryonic day (E) 16.5 in cochlear endolymph of Slc26a4 (Δ/+) and Slc26a4 (Δ/Δ) mice. Shortly before birth the K(+) concentration began to rise. Immediately after birth (postnatal day 0), the Na(+) and K(+) concentrations in cochlear endolymph were each ∼80 mM. In Slc26a4 (Δ/Δ) mice, the rise in the K(+) concentration occurred with a ∼3 day delay. K(+) concentrations were also found to be low (∼15 mM) in the embryonic endolymphatic sac. The onset of expression of the K(+) channel KCNQ1 and the Na(+)/2Cl(-)/K(+) cotransporter SLC12A2 occurred in the cochlea at E19.5 in Slc26a4 (Δ/+) and Slc26a4 (Δ/Δ) mice. These data demonstrate that endolymph, at the time at which the enlargement develops, is a Na(+)-rich fluid, which transitions into a K(+)-rich fluid before birth. The data suggest that the endolymphatic enlargement caused by a loss of Slc26a4 is a consequence of disrupted Na(+) transport.


Conflict of interest statement

Competing Interests: The authors have declared that no competing interests exist.

Figures

Figure 1
Figure 1. Schematic diagrams of the inner ear and of experimental configurations.
A) Diagram of the bone-enclosed inner ear consisting of the cochlea, the vestibular labyrinth and the endolymphatic duct and sac. Note, that scala media of the cochlea is accessible via the round window and that the endolymphatic sac is the only structure not enclosed in bone. B–E) Experimental configurations for the measurement of voltages and of Na+ and K+ concentrations. Voltage electrodes were used to record the voltage (V) and ion-selective electrodes, which were filled at the tip with liquid ion exchanger, recorded a signal that consisted of the sum of the voltage (V) and the ion-voltage (VK+ or VNa+). B) Configuration for in situ measurements of voltage and K+ concentrations in the cochlea. C–E) Configuration for in vitro measurements. Temporal bones were isolated and superfused in a bath chamber that was outfitted with an inflow and a suction outlet. C) Configuration for in vitro measurements of voltage and K+ concentrations in the cochlea. D) Configuration for in vitro measurements of voltage and K+ concentrations in the endolymphatic sac. E) Configuration for in vitro measurements of Na+ and K+ concentrations in the cochlea.
Figure 2
Figure 2. Selectivity and sensitivity of Na+ and K+-selective electrodes.
Electrodes were calibrated using mixtures of NaCl and KCl and the resulting two- or three-dimensional data (red dots) were fitted to the Nicolski equation (black lines). A) Three-dimensional calibration of K+ selective electrodes. Curve 1: The KCl concentration was varied between 10 and 150 mM in the presence of a constant NaCl concentration of 10 mM. Curve 2: The NaCl concentration was varied between 10 to 150 mM in the presence of a constant KCl concentration of 3 mM. Curve 3: The NaCl concentration was varied between 10 to 150 mM in the presence of a constant KCl concentration of 35 mM. Curve 4: The NaCl concentration was varied between 10 to 150 mM in the presence of a constant KCl concentration of 68 mM. Note, that K+ selective electrodes were highly selective for K+ which is evident from the steep relationship between the Voltage and the KCl concentration (Curve 1) and the flat relationships between the voltage and the NaCl concentration (Curves 2–4). B) Three-dimensional calibration of Na+ selective electrodes. Curve 1: The NaCl concentration was varied between 10 and 150 mM in the presence of a constant KCl concentration of 3 mM. Curve 2: The NaCl concentration was varied between 10 to 150 mM in the presence of a constant KCl concentration of 13 mM. Curve 3: The KCl concentration was varied between 10 to 150 mM in the presence of a constant NaCl concentration of 10 mM. Note, that Na+ selective electrodes were highly selective for Na+ but, although to a lesser degree, also detected K+, which is evident from the steep relationships between the Voltage and the NaCl concentration (Curve 1 and 2) and the less steep relationship between the voltage and the KCl concentration (Curve 3). C) Two-dimensional calibration of K+ selective electrodes. Calibration procedures were simplified by using solutions in which the sum of NaCl and KCl was maintained constant at 150 mM.
Figure 3
Figure 3. Measurements of the K+ concentration and the endocochlear potential in situ and in vitro in adult Slc26a4 Δ/+ mice.
A–B) Representative traces of in situ measurements. Penetration and withdrawal from the epithelium are marked (filled triangles). Upon establishment of a stable voltage recording, the paralytic agent succinyl-choline chloride (SCC) was injected to induced anoxia. Note that the endocochlear potential, which is positive under normoxic conditions, declined under anoxic conditions within 3 min to negative values. The K+ concentration, however, was maintained constant during the recording time. C–D) Representative traces of in vitro measurements. Penetration and withdrawal from the epithelium are marked (filled triangles). E–F) Data summary. Note that the K+ concentrations recorded in vitro were similar to measurements made in situ and that the endocochlear potential in vitro was negative similar to in situ measurements under anoxic conditions. Numbers next to bars represents the number of animals.
Figure 4
Figure 4. Summary of measurements of the endolymphatic K+ concentration and transepithelial voltage in vitro in the cochlea and the endolymphatic sac of Slc26a4 Δ/+ (black symbols) and Slc26a4 Δ/Δ mice (red symbols).
A–B) Measurements in the cochlea. C–D) Measurements in the endolymphatic sac. Measurements in Slc26a4 Δ/Δ mice that differed significantly from measurements in Slc26a4 Δ/+ mice are marked (*).
Figure 5
Figure 5. Measurements of the endolymphatic Na+ and K+ concentrations in vitro.
A) Representative traces of the Na+ (red) and K+ (black) concentration in the cochlea of an Slc26a4 Δ/+ mouse at age E16.5. B) Representative traces of the Na+ (red) and K+ (black) concentration in the cochlea of an Slc26a4 Δ/+ mouse at age P0. C–D) Summary of Na+ and K+ concentration measurements in cochlear endolymph in Slc26a4 Δ/+ and Slc26a4 Δ/Δ mice at age E16.5 and P0. Numbers next to bars represent the number of animals.
Figure 6
Figure 6. Expression of mRNAs that code for selected Na+ and K+ channels and transporters in the cochlea of Slc26a4 Δ/+ and Slc26a4 Δ/Δ mice.
A) The α-subunit of the Na+/K+ ATPase Atp1a1. B) The Na+/2Cl/K+ cotransporter Slc12a2. C) The α-subunit of the K+ channel Kcnq1. D–F) The α-, β- and γ-subunit of the Na+ channel ENaC. Measurements in Slc26a4 Δ/Δ mice that differed significantly from measurements in Slc26a4 Δ/+ mice are marked (*).
Figure 7
Figure 7. Expression of protein of the K+ channel KCNQ1 and the Na+/2Cl/K+ cotransporter SLC12A2 in the cochlea.
A–D) Expression of KCNQ1 (red) in the cochlea of Slc26a4 Δ/+ and Slc26a4 Δ/Δ mice at ages E17.5 and E19.5. E–H) Expression of SLC12A2 (red) in the cochlea of Slc26a4 Δ/+ and Slc26a4 Δ/Δ mice at ages E17.5 and E19.5. Note that the onset of expression of KCNQ1 and SLC12A2 occurred in Slc26a4 Δ/+ and Slc26a4 Δ/Δ mice between E17.5 and E19.5. Further, note that images of Slc26a4 Δ/+ and Slc26a4 Δ/Δ mice are reproduced at the same magnification to illustrate the dramatic enlargement in Slc26a4 Δ/Δ mice. Stains included DAPI for nuclei (blue) and phalloidin for F-actin (green). Abbreviations: SV, Stria vascularis; K, Köllikers organ.

Similar articles

Cited by

References

    1. Griffith AJ, Wangemann P (2011) Hearing loss associated with enlargement of the vestibular aqueduct: mechanistic insights from clinical phenotypes, genotypes, and mouse models. Hear Res 281: 11–17. - PMC - PubMed
    1. Albert S, Blons H, Jonard L, Feldmann D, Chauvin P, et al. (2006) SLC26A4 gene is frequently involved in nonsyndromic hearing impairment with enlarged vestibular aqueduct in Caucasian populations. Eur J Hum Genet 14: 773–779. - PubMed
    1. Anwar S, Riazuddin S, Ahmed ZM, Tasneem S, Ateeq uJ, et al. (2009) SLC26A4 mutation spectrum associated with DFNB4 deafness and Pendred's syndrome in Pakistanis. J Hum Genet 54: 266–270. - PubMed
    1. Choi BY, Stewart AK, Madeo AC, Pryor SP, Lenhard S, et al. (2009) Hypo-functional SLC26A4 variants associated with nonsyndromic hearing loss and enlargement of the vestibular aqueduct: genotype-phenotype correlation or coincidental polymorphisms? Hum Mutat 30: 599–608. - PMC - PubMed
    1. Park HJ, Shaukat S, Liu XZ, Hahn SH, Naz S, et al. (2003) Origins and frequencies of SLC26A4 (PDS) mutations in east and south Asians: global implications for the epidemiology of deafness. J Med Genet 40: 242–248. - PMC - PubMed

Publication types