

Near their thresholds for detection, shapes are discriminated by the angular separation of their corners
- PMID: 23741521
- PMCID: PMC3669261
- DOI: 10.1371/journal.pone.0066015
Near their thresholds for detection, shapes are discriminated by the angular separation of their corners
Abstract
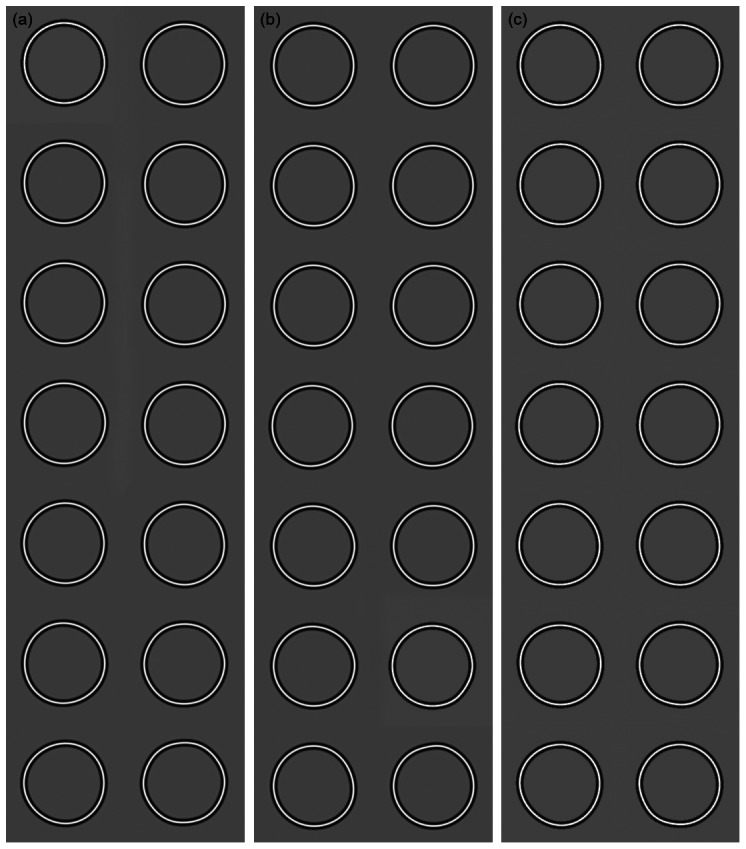
Observers make sense of scenes by parsing images on the retina into meaningful objects. This ability is retained for line drawings, demonstrating that critical information is concentrated at object boundaries. Information theoretic studies argue for further concentration at points of maximum curvature, or corners, on such boundaries [1]-[3] suggesting that the relative positions of such corners might be important in defining shape. In this study we use patterns subtly deformed from circular, by a sinusoidal modulation of radius, in order to measure threshold sensitivity to shape change. By examining the ability of observers to discriminate between patterns of different frequency and/or number of cycles of modulation in a 2x2 forced choice task we were able to show, psychophysically, that difference in a single cue, the periodicity of the corners (specifically the polar angle between two points of maximum curvature) was sufficient to allow discrimination of two patterns near their thresholds for detection. We conclude that patterns could be considered as labelled for this measure. These results suggest that a small number of such labels might be sufficient to identify an object.
Conflict of interest statement
Figures


Similar articles
-
Tolerance for local and global differences in the integration of shape information.J Vis. 2015 Mar 26;15(3):21. doi: 10.1167/15.3.21. J Vis. 2015. PMID: 25814547
-
Global shape processing: A behavioral and electrophysiological analysis of both contour and texture processing.J Vis. 2015;15(13):18. doi: 10.1167/15.13.18. J Vis. 2015. PMID: 26401625
-
Detection and recognition of angular frequency patterns.Vision Res. 2015 May;110(Pt A):51-6. doi: 10.1016/j.visres.2015.02.022. Epub 2015 Mar 14. Vision Res. 2015. PMID: 25782363
-
The computation of relative numerosity, size and density.Vision Res. 2016 Jul;124:15-23. doi: 10.1016/j.visres.2014.12.022. Epub 2015 Jan 14. Vision Res. 2016. PMID: 25595856 Free PMC article.
-
Nothing more than a pair of curvatures: A common mechanism for the detection of both radial and non-radial frequency patterns.Vision Res. 2017 May;134:18-25. doi: 10.1016/j.visres.2017.03.005. Epub 2017 Apr 12. Vision Res. 2017. PMID: 28404520
Cited by
-
Mutual Information and Categorical Perception.Psychol Sci. 2021 Aug;32(8):1298-1310. doi: 10.1177/0956797621996663. Epub 2021 Jul 20. Psychol Sci. 2021. PMID: 34283691 Free PMC article.
-
Poorer Search Efficiency in Healthy Young Adults With High Schizotypal Personality Traits.Front Psychiatry. 2018 Jul 12;9:285. doi: 10.3389/fpsyt.2018.00285. eCollection 2018. Front Psychiatry. 2018. PMID: 30050472 Free PMC article.
-
Poorer Integration of Local Orientation Information Occurs in Students With High Schizotypal Personality Traits.Front Psychiatry. 2018 Oct 24;9:518. doi: 10.3389/fpsyt.2018.00518. eCollection 2018. Front Psychiatry. 2018. PMID: 30405458 Free PMC article.
References
-
- Attneave F (1954) Some informational aspects of visual perception. Psychological Review 61: 183–193. - PubMed
-
- Biederman I, Cooper EE (1991) Priming contour-deleted images: Evidence for intermediate representations in visual object recognition. Cognitive Psychology 23: 393–419. - PubMed
-
- Feldman J, Singh M (2005) Information Along Contours and Object Boundaries. Psychological Review 112: 243–252. - PubMed
-
- Barlow HB (1972) Single units and sensation: A neuron doctrine for perceptual psychology? Perception 1: 371–394. - PubMed
-
- Barlow HB, Parker AJ, Singer W, Thorpe SJ (2009) Barlow's 1972 paper. Perception 38: 795–807. - PubMed
Publication types
MeSH terms
LinkOut - more resources
Full Text Sources
Other Literature Sources
