. 2013 May 28:2:e00731.
doi: 10.7554/eLife.00731.

The rise and fall of the Phytophthora infestans lineage that triggered the Irish potato famine

Affiliations

The rise and fall of the Phytophthora infestans lineage that triggered the Irish potato famine

Kentaro Yoshida et al. Elife. .

Erratum in

  • Elife. 2013;2:e01108

Abstract

Phytophthora infestans, the cause of potato late blight, is infamous for having triggered the Irish Great Famine in the 1840s. Until the late 1970s, P. infestans diversity outside of its Mexican center of origin was low, and one scenario held that a single strain, US-1, had dominated the global population for 150 years; this was later challenged based on DNA analysis of historical herbarium specimens. We have compared the genomes of 11 herbarium and 15 modern strains. We conclude that the 19th century epidemic was caused by a unique genotype, HERB-1, that persisted for over 50 years. HERB-1 is distinct from all examined modern strains, but it is a close relative of US-1, which replaced it outside of Mexico in the 20th century. We propose that HERB-1 and US-1 emerged from a metapopulation that was established in the early 1800s outside of the species' center of diversity. DOI:http://dx.doi.org/10.7554/eLife.00731.001.

Keywords: Herbarium; Other; Phytophthora infestans; Solanum tuberosum; ancient DNA.


Conflict of interest statement

DW: Deputy editor, eLife.

The other authors declare that no competing interests exist.

Figures

Figure 1.
Figure 1.. Countries of origin of samples used in whole-genome, mtDNA genome or both analyses.
Red indicates number of historic and blue of modern samples. More information on the samples is given in Tables 1 and 2. DOI: http://dx.doi.org/10.7554/eLife.00731.004
Figure 2.
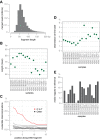
Figure 2.. Ancient DNA-like characteristic of historic samples.
(A) Lengths of merged reads from historic sample M-0182898. (B) Mean lengths of merged reads from historic samples. (C) Nucleotide mis-incorporation in reads from the historic sample M-0182898. (D) Deamination at first 5′ end base in historic samples. (E) Percentage of merged reads that mapped to the P. infestans reference genome. DOI: http://dx.doi.org/10.7554/eLife.00731.006
Figure 3.
Figure 3.. Coverage and SNP statistics.
(A) Mean nuclear genome coverage from historic (red) and modern (blue) samples. (B) Homo- and heterozygous SNPs in each sample. (C) Inverse cumulative coverage for all homozygous SNPs across all samples. (D) Same as (C) for homo- and heterozygous SNPs. DOI: http://dx.doi.org/10.7554/eLife.00731.007
Figure 3—figure supplement 1.
Figure 3—figure supplement 1.. Accuracy and sensitivity of SNP calling at different cutoffs for SNP concordance based on 3- and 50-fold coverage of simulated data.
Rescue cov.—minimum coverage required to accept SNP calls in low-coverage genomes based on these SNPs having been found in high-coverage genomes. The cutoffs enclosed in orange rectangles were used for the final analysis. DOI: http://dx.doi.org/10.7554/eLife.00731.008
Figure 4.
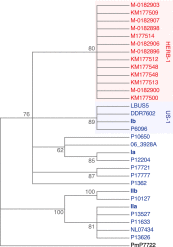
Figure 4.. Maximum-parsimony phylogenetic tree of complete mtDNA genomes.
Sites with less than 90% information were not considered, leaving 24,560 sites in the final dataset. Numbers at branches indicate bootstrap support (100 replicates), and scale indicates changes. DOI: http://dx.doi.org/10.7554/eLife.00731.009
Figure 4—figure supplement 1.
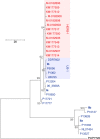
Figure 4—figure supplement 1.. Maximum-likelihood phylogenetic tree of complete mtDNA genomes.
Sites with less than 90% information were not considered, leaving 24,560 sites in the final dataset. Numbers at branches indicate bootstrap support (100 replicates). DOI: http://dx.doi.org/10.7554/eLife.00731.010
Figure 4—figure supplement 2.
Figure 4—figure supplement 2.. mtDNA sequences around diagnostic Msp1 restriction site (grey) for reference haplotype modern strains (blue) and historic strains (red).
The Msp1 (CCGG) restriction site is only present in the Ib haplotype; all other strains have a C-to-T substitution (CTGG). DOI: http://dx.doi.org/10.7554/eLife.00731.011
Figure 5.
Figure 5.. Correlation between nucleotide distance of mtDNA genomes of HERB-1/haplotype Ia/haplotype Ib clade to the outgroup P17777 and sample age in calendar years before present.
DOI: http://dx.doi.org/10.7554/eLife.00731.012
Figure 6.
Figure 6.. Divergence estimates of mtDNA genomes.
Bayesian consensus tree from 147,000 inferred trees. Posterior probability support above 50% is shown next to each node. Blue horizontal bars represent the 95% HPD interval for the node height. Light yellow bars indicate major historical events discussed in the text. See Figure 5 and Table 3 for detailed estimates at the four main nodes in P. infestans. DOI: http://dx.doi.org/10.7554/eLife.00731.013
Figure 7.
Figure 7.. Phylogenetic trees of high-coverage nuclear genomes using both homozygous and heterozygous SNPs.
(A) Maximum-parsimony tree, considering only sites with at least 95% information, leaving 4,498,351 sites in the final dataset. Numbers at branches indicate bootstrap support (100 replicates), and scale indicates genetic distance. (B) Maximum-likelihood tree. (C) Heat map of genetic differentiation (color scale indicates SNP differences). US-1 strains DDR7062 and LBUS5 have the genomes sequences closest to M-0182896 (asterisks). The two US-1 isolates in turn are outliers compared to all other modern strains (highlighted by a gray box). DOI: http://dx.doi.org/10.7554/eLife.00731.015
Figure 7—figure supplement 1.
Figure 7—figure supplement 1.. Phylogenetic trees of high- and low-coverage nuclear genomes.
(A) Neighbor-joining tree of high-coverage genomes using 4,595,012 homo- and heterozygous SNPs. Numbers at branches indicate bootstrap support (100 replicates), and scale indicates genetic distance. (B) Neighbor-joining tree of high- and low-coverage genomes using 2,101,039 homozygous and heterozygous SNPs. Numbers at branches indicate bootstrap support above 50, from 100 replicates. Scale indicates genetic distance. (C) Maximum parsimony tree of high- and low-coverage genomes using 315,394 SNPs homozygous and heterozygous SNPs (using only sites with at least 80% information). DOI: http://dx.doi.org/10.7554/eLife.00731.016
Figure 8.
Figure 8.. Ploidy analysis.
(A) Diagram of expected read frequencies of reads at biallelic SNPs for diploid, triploid and tetraploid genomes. (B) Reference read frequency at biallelic SNPs in gene dense regions (GDRs) for the historic sample M-0182896, two modern samples, and simulated diploid, triploid and tetraploid genomes. The simulated tetraploid genome is assumed to have 20% of pattern 1 and 80% of pattern 3 shown in (A). The shape and kurtosis of the observed distributions are similar to the corresponding simulated ones. (C) Polymorphic positions with more than one allele in the GDR. DOI: http://dx.doi.org/10.7554/eLife.00731.017
Figure 8—figure supplement 1.
Figure 8—figure supplement 1.. Reference read frequency at biallelic SNPs in gene dense regions (GDRs) for five modern high-coverage samples.
DOI: http://dx.doi.org/10.7554/eLife.00731.018
Figure 9.
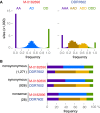
Figure 9.. Read allele frequencies of historic genome M-0182896 and US-1 isolate DDR7602.
Alleles were classified as ancestral or derived using outgroup species P. mirabilis and P. ipomoeae. There were 40,532 segregating sites. (A) Distributions of derived alleles at sites segregating between M-0182896 and DDR7602. (B) Annotation of the different site classes. DOI: http://dx.doi.org/10.7554/eLife.00731.019
Figure 10.
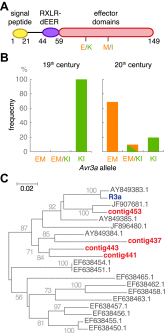
Figure 10.. The effector gene Avr3a and its cognate resistance gene R3a.
(A) Diagram of AVR3A effector protein. (B) Frequency of Avr3a alleles in historic and modern P. infestans strains. (C) Neighbor-joining tree of R3a homologs from potato, based on 0.67 kb partial nucleotide sequences of S. tuberosum R3a (blue, accession number AY849382.1) and homologs (dark grey) in GenBank, and de novo assembled contigs from M-0182896 (red). Numbers at branches indicate bootstrap support with 500 replicates. Scale indicates changes. DOI: http://dx.doi.org/10.7554/eLife.00731.023
Figure 10—figure supplement 1.
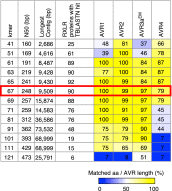
Figure 10—figure supplement 1.. Summary of de novo assembly of RXLR effector genes.
TBLASTN query was performed with 549 RXLR proteins as a query and contigs as a database. When the High-scoring Segment Pair (HSP) and matched amino acids both covered ≥99% of the query length, we recorded a hit. Results with the optimal k-mer size are highlighted. DOI: http://dx.doi.org/10.7554/eLife.00731.024
Figure 11.
Figure 11.. Suggested paths of migration and diversification of P. infestans lineages HERB-1 and US-1.
The location of the metapopulation that gave rise to HERB-1 and US-1 remains uncertain; here it is proposed to have been in North America. DOI: http://dx.doi.org/10.7554/eLife.00731.025

Comment in

  • The early days of late blight.
    Birch PR, Cooke DE. Birch PR, et al. Elife. 2013 Jun 18;2:e00954. doi: 10.7554/eLife.00954. Elife. 2013. PMID: 23795302 Free PMC article.

References

    1. Altschul SF, Gish W, Miller W, Myers EW, Lipman DJ. 1990. Basic local alignment search tool. J Mol Biol 215:403–10. 10.1006/jmbi.1990.9999 - DOI - PubMed
    1. Armstrong MR, Whisson SC, Pritchard L, Bos JI, Venter E, Avrova AO, et al. 2005. An ancestral oomycete locus contains late blight avirulence gene Avr3a, encoding a protein that is recognized in the host cytoplasm. Proc Natl Acad Sci USA 102:7766–71. 10.1073/pnas.0500113102 - DOI - PMC - PubMed
    1. Bos KI, Schuenemann VJ, Golding GB, Burbano HA, Waglechner N, Coombes BK, et al. 2011. A draft genome of Yersinia pestis from victims of the Black Death. Nature 478:506–10. 10.1038/nature10549 - DOI - PMC - PubMed
    1. Bos KI, Stevens P, Nieselt K, Poinar HN, Dewitte SN, Krause J. 2012. Yersinia pestis: new evidence for an old infection. PLOS ONE 7:e49803. 10.1371/journal.pone.0049803 - DOI - PMC - PubMed
    1. Bourke PMA. 1964. Emergence of potato blight, 1843-46. Nature 203:805–8. 10.1038/203805a0 - DOI

Publication types

Substances