

Will reducing sugar-sweetened beverage consumption reduce obesity? Evidence supporting conjecture is strong, but evidence when testing effect is weak
- PMID: 23742715
- PMCID: PMC3929296
- DOI: 10.1111/obr.12048
Will reducing sugar-sweetened beverage consumption reduce obesity? Evidence supporting conjecture is strong, but evidence when testing effect is weak
Abstract
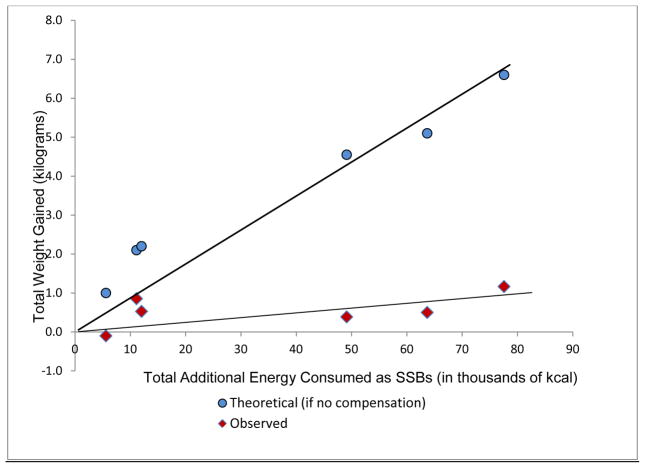
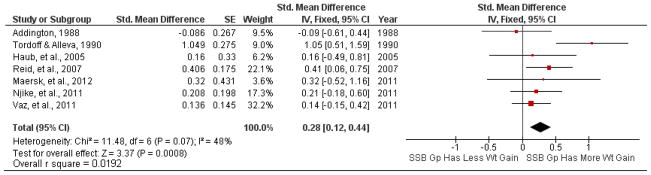
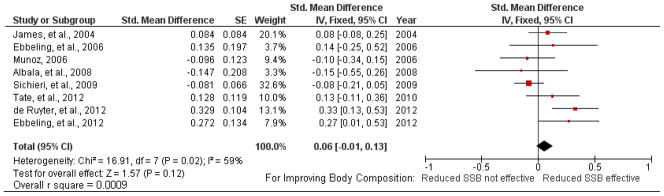
We provide arguments to the debate question and update a previous meta-analysis with recently published studies on effects of sugar-sweetened beverages (SSBs) on body weight/composition indices (BWIs). We abstracted data from randomized controlled trials examining effects of consumption of SSBs on BWIs. Six new studies met these criteria: (i) human trials, (ii) ≥ 3 weeks duration, (iii) random assignment to conditions differing only in consumption of SSBs and (iv) including a BWI outcome. Updated meta-analysis of a total of seven studies that added SSBs to persons' diets showed dose-dependent increases in weight. Updated meta-analysis of eight studies attempting to reduce SSB consumption showed an equivocal effect on BWIs in all randomized subjects. When limited to subjects overweight at baseline, meta-analysis showed a significant effect of roughly 0.25 standard deviations (more weight loss/less weight gain) relative to controls. Evidence to date is equivocal in showing that decreasing SSB consumption will reduce the prevalence of obesity. Although new evidence suggests that an effect may yet be demonstrable in some populations, the integrated effect size estimate remains very small and of equivocal statistical significance. Problems in this research area and suggestions for future research are highlighted.
Keywords: Obesity; randomized controlled trials; soft drinks; weight loss..
© 2013 The Authors. obesity reviews © 2013 International Association for the Study of Obesity.
Conflict of interest statement
Competing Interests: In the last 36 months, Dr. Allison has received consulting fees from Kraft Foods. The University of Alabama at Birmingham has received gifts and grants from multiple organizations including but not limited to The Coca-Cola Company, PepsiCo, Red Bull, and Kraft Foods. Drs. Kaiser, Keating, and Shikany have no competing interests to report.
Figures

Comment on
-
Resolved: there is sufficient scientific evidence that decreasing sugar-sweetened beverage consumption will reduce the prevalence of obesity and obesity-related diseases.Obes Rev. 2013 Aug;14(8):606-19. doi: 10.1111/obr.12040. Epub 2013 Jun 13. Obes Rev. 2013. PMID: 23763695 Free PMC article. Review.
References
-
- U.S. Preventive Services Task Force. US Preventive Services Task Force Procedure Manual. 2008.
-
- Casazza K, Allison DB. Stagnation in the Clinical, Community, and Public Health Domain of Obesity: The Need for Probative Research. Clinical Obesity. 2012;2:83–85. - PubMed
-
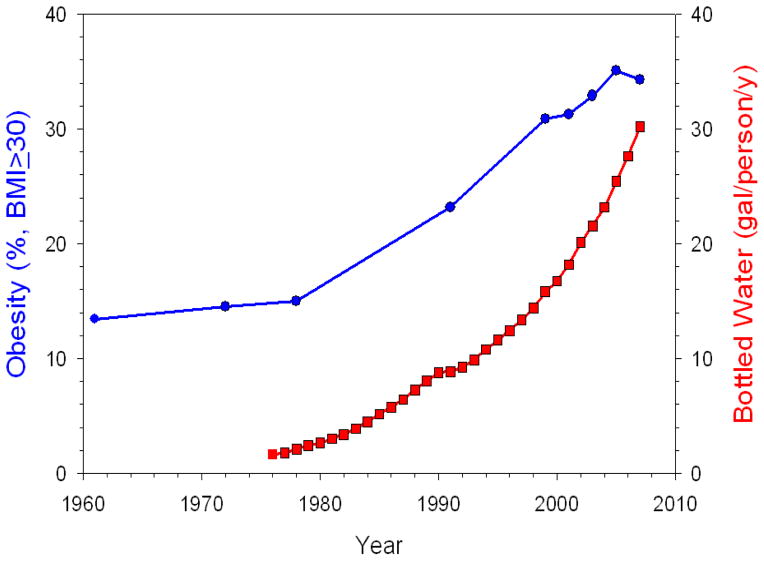
- [Accessed: 12-14-2012];Bottled Water Consumption Per Person in the United States, 1976–2007. Posted: 12-7-2007. Available at: http://www.earth-policy.org/index.php?/data_center/C21/
Publication types
MeSH terms
Substances
Grants and funding
LinkOut - more resources
Full Text Sources
Other Literature Sources
Medical
Miscellaneous
