. 2013 Nov;23(11):1874-84.
doi: 10.1101/gr.154815.113. Epub 2013 Jun 6.

Network properties derived from deep sequencing of human B-cell receptor repertoires delineate B-cell populations

Affiliations

Network properties derived from deep sequencing of human B-cell receptor repertoires delineate B-cell populations

Rachael J M Bashford-Rogers et al. Genome Res. 2013 Nov.

Abstract

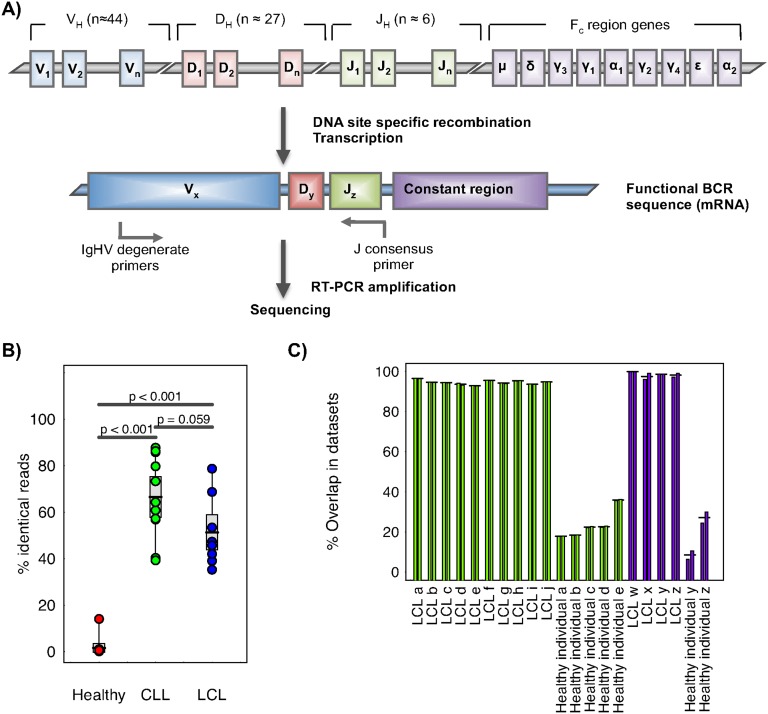
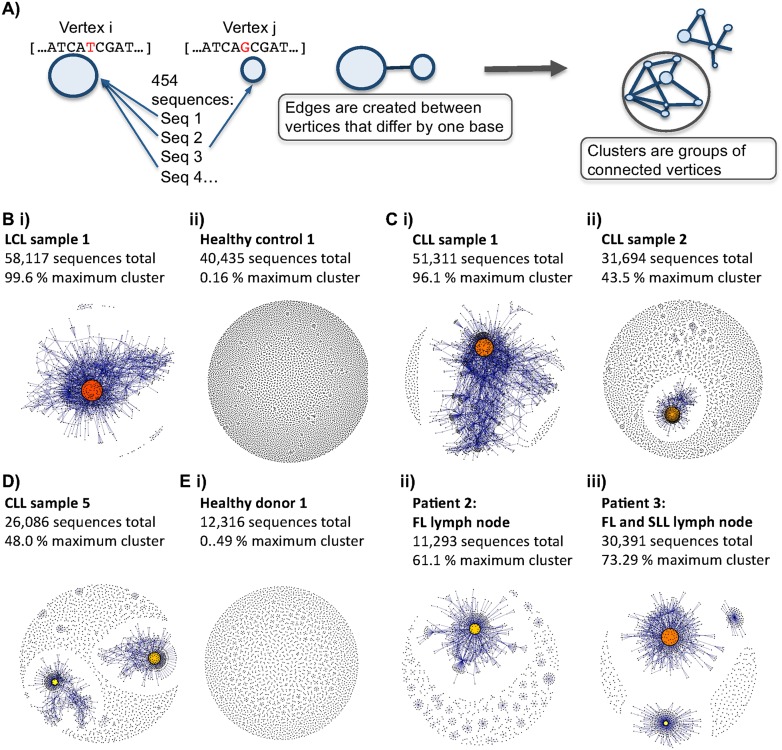
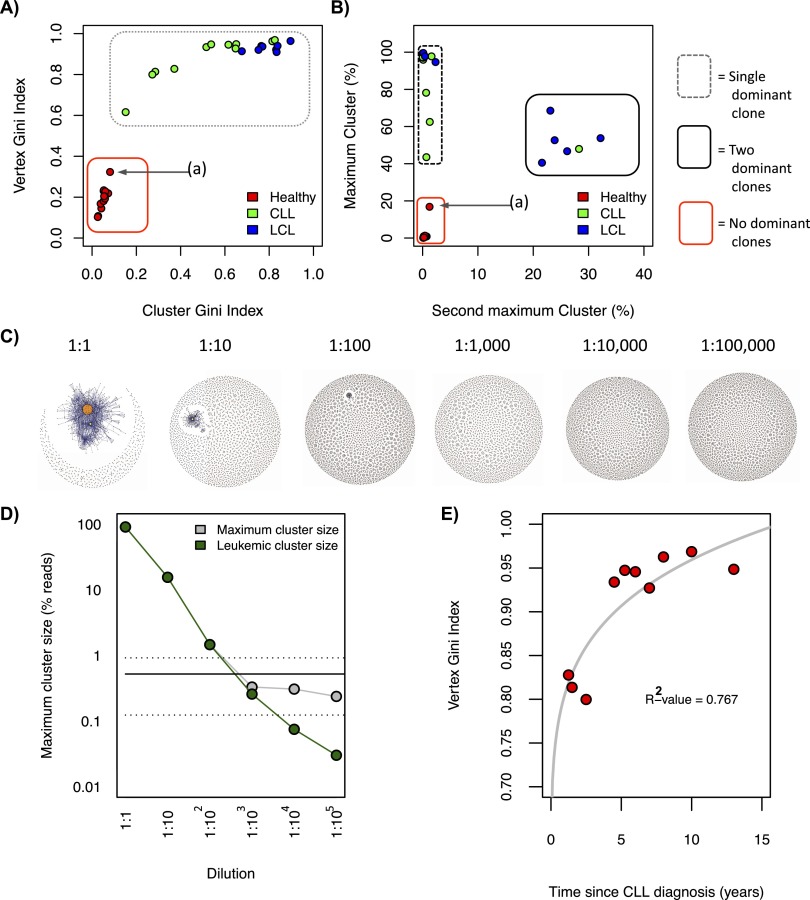
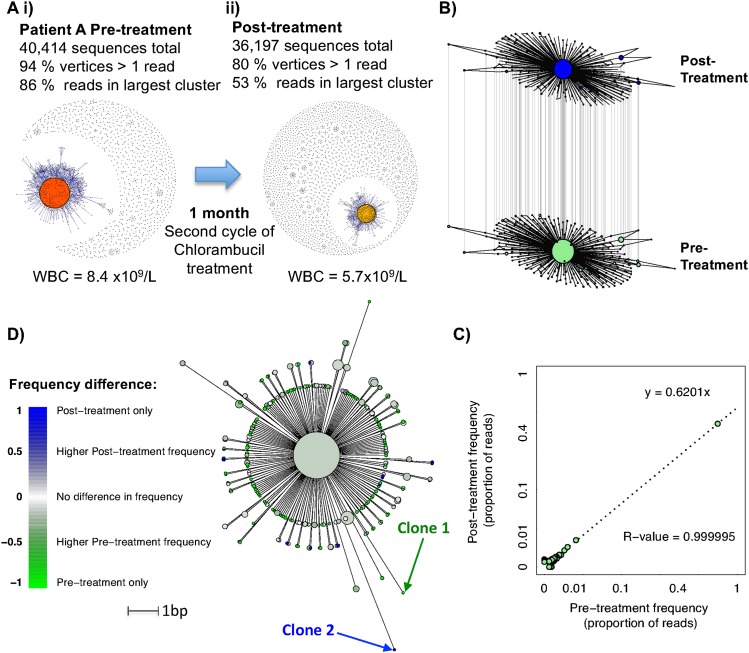
The adaptive immune response selectively expands B- and T-cell clones following antigen recognition by B- and T-cell receptors (BCR and TCR), respectively. Next-generation sequencing is a powerful tool for dissecting the BCR and TCR populations at high resolution, but robust computational analyses are required to interpret such sequencing. Here, we develop a novel computational approach for BCR repertoire analysis using established next-generation sequencing methods coupled with network construction and population analysis. BCR sequences organize into networks based on sequence diversity, with differences in network connectivity clearly distinguishing between diverse repertoires of healthy individuals and clonally expanded repertoires from individuals with chronic lymphocytic leukemia (CLL) and other clonal blood disorders. Network population measures defined by the Gini Index and cluster sizes quantify the BCR clonality status and are robust to sampling and sequencing depths. BCR network analysis therefore allows the direct and quantifiable comparison of BCR repertoires between samples and intra-individual population changes between temporal or spatially separated samples and over the course of therapy.


Figures

Figure 1.
Figure 1.
Sequencing of B-cell receptor repertoires. (A) Representation of the genomic rearrangement process during V-D-J recombination to generate the heavy-chain B-cell receptor. B-cell receptor amplification was performed by reverse transcription on total RNA by single J region primer, and subsequent multiplex PCR amplification. (B) The percentage of reads corresponding to the highest expressed B-cell receptor sequence for each sample, separated into sample type: healthy individuals, chronic lymphocytic leukemia patients (CLL), and human lymphoblastoid cell lines (LCL). Two-sided t-tests were performed between the sample subsets, with the P-values indicated above. (C) Percentage of sequences shared between runs for technical repeats for (1) the RT-PCR and resequencing (RT-PCR repeats, green bars), and (2) the 454 sequencing from the same RT-PCR product (sequencing repeats, purple bars). For each sample, two repeats were performed and the percentage of reads shared between the repeats is shown (each repeat is compared with the other, so two bars are shown per sample).
Figure 2.
Figure 2.
B-cell receptor repertoires from different samples. (A) Schematic diagram showing the method by which the sequencing networks are generated: Each vertex represents a unique sequence, where the relative size of the vertex is proportional to the number of 454 sequencing reads that were identical to the vertex sequence. Edges are created between vertices that differ by one base (indel or substitution). The vertex colors correspond to the relative abundance of the corresponding sequences, where red, orange, and yellow indicates observation of a sequence in >90%, between 40%–90%, and <40% of the reads in the sample, respectively. (B) Comparison of BCR sequence networks between (i) a typical LCL sample and (ii) a typical healthy individual. (C) BCR sequence networks of CLL patients with (i) extensive clonal enlargement and (ii) limited clonal expansion. (D) BCR sequence networks of CLL patient 5 showing expansion of two dominant clusters. (E) Networks generated from sequencing data set from Boyd et al. (2009) of (i) healthy donor 1, (ii) patient 2 with follicular lymphoma (FL), and (iii) patient 3 with FL and small lymphocytic lymphoma (SLL).
Figure 3.
Figure 3.
Measures differentiating between B-cell receptor populations. (A) Cluster Gini Index plotted against vertex Gini Index for 13 healthy individual samples, 11 chronic lymphocytic leukemia (CLL), and eight human lymphoblastoid cell line (LCL) samples. Point (a) corresponds with healthy individual 10. The red box and gray dashed box distinguish between the regions occupied between diverse and clonal populations, respectively. (B) The second maximum cluster sizes plotted against the maximum cluster sizes. The red, gray-dashed, and black solid boxes distinguish between the regions occupied between unexpanded populations, monoclonal expanded populations, and biclonally expanded populations, respectively. (C) B-cell receptor networks for the titration of a chronic lymphocytic leukemia clonal sample into healthy peripheral blood from the data set from Boyd et al. (2009), and (D) the corresponding number of reads corresponding to the leukemic clone (green) and the maximum cluster size of each dilution (gray). The solid horizontal line shows the mean maximum cluster size for healthy individuals from this data set (0.52% of total reads), and the dashed horizontal lines show the mean ±SD of maximum cluster size for healthy individuals for this data set. (E) Correlation between the Gini Index and the length of time since chronic lymphocytic leukemia (CLL) diagnosis for each patient in our data set, with corresponding R2-value.
Figure 4.
Figure 4.
B-cell leukemic clonal evolution. (A) The B-cell sequence networks for patient A with chronic lymphocytic leukemia for samples (i) prior to and (ii) after second cycle of Chlorambucil treatment, separated by 1 mo with corresponding white blood cell counts. (B) All sequences from the dominant clusters from both temporal samples were used to generate a composite network, and the differential frequencies at each time point are indicated by the relative vertex sizes. (C) Correlation between the proportional frequencies of each unique BCR within the dominant clones of patient A with corresponding R-value and linear regression equation. (D) An unrooted maximum parsimony tree was generated showing the relationships between sequences that were observed at least six times between the pre- and post-treatment samples, where the branch lengths are proportional to the number of varying bases (evolutionary distance). The tip colors show the relative difference in sequence abundance between the different time points, where green indicates observation of sequence primarily in the pretreatment sample, blue indicates predominant observations in the post-treatment sample, and white indicates no change in frequency. Clones 1 and 2 refer to examples of BCRs observed only in the pre- or post-treatment samples, respectively.

Comment in

References

    1. Altschul SF, Gish W, Miller W, Myers EW, Lipman DJ 1990. Basic local alignment search tool. J Mol Biol 215: 403–410 - PubMed
    1. Arber DA 2000. Molecular diagnostic approach to non-Hodgkin's lymphoma. J Mol Diagn 2: 178–190 - PMC - PubMed
    1. Arnaout R, Lee W, Cahill P, Honan T, Sparrow T, Weiand M, Nusbaum C, Rajewsky K, Koralov SB 2011. High-resolution description of antibody heavy-chain repertoires in humans. PLoS ONE 6: e22365. - PMC - PubMed
    1. Bagnara D, Callea V, Stelitano C, Morabito F, Fabris S, Neri A, Zanardi S, Ghiotto F, Ciccone E, Grossi CE, et al. 2006. IgV gene intraclonal diversification and clonal evolution in B-cell chronic lymphocytic leukaemia. Br J Haematol 133: 50–58 - PubMed
    1. Batrak V, Blagodatski A, Buerstedde JM 2011. Understanding the immunoglobulin locus specificity of hypermutation. Methods Mol Biol 745: 311–326 - PubMed

Publication types

MeSH terms

Substances

LinkOut - more resources