. 2013 Jul 26;288(30):22163-73.
doi: 10.1074/jbc.M113.484329. Epub 2013 Jun 6.

Lipid, detergent, and Coomassie Blue G-250 affect the migration of small membrane proteins in blue native gels: mitochondrial carriers migrate as monomers not dimers

Affiliations

Lipid, detergent, and Coomassie Blue G-250 affect the migration of small membrane proteins in blue native gels: mitochondrial carriers migrate as monomers not dimers

Paul G Crichton et al. J Biol Chem. .

Abstract

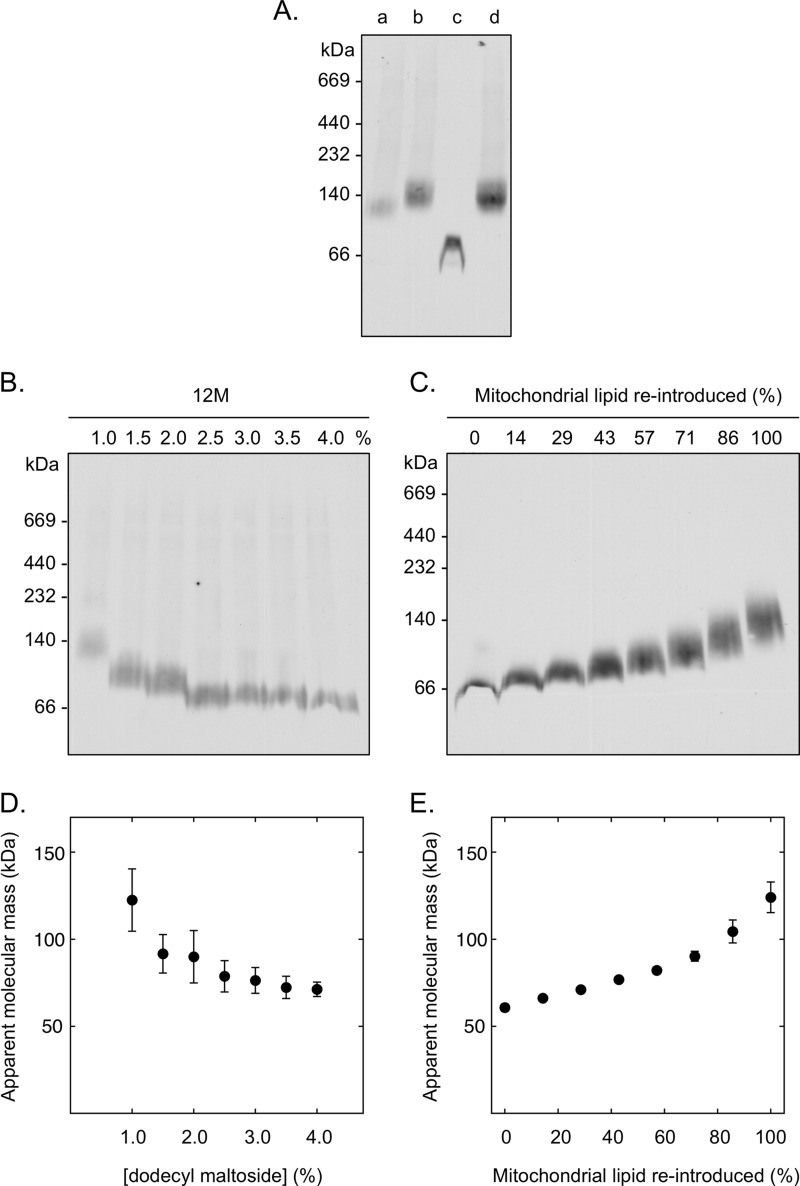
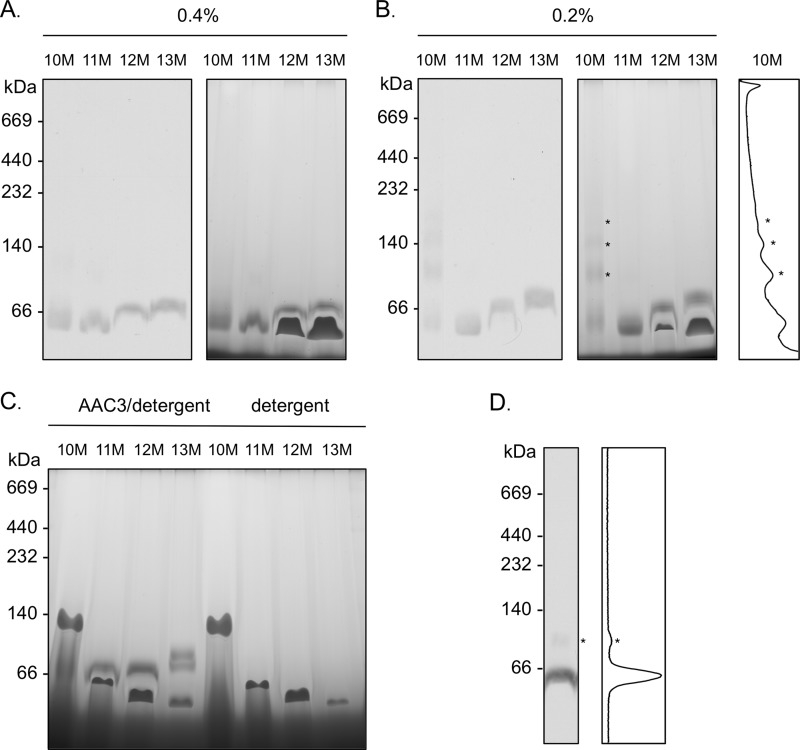
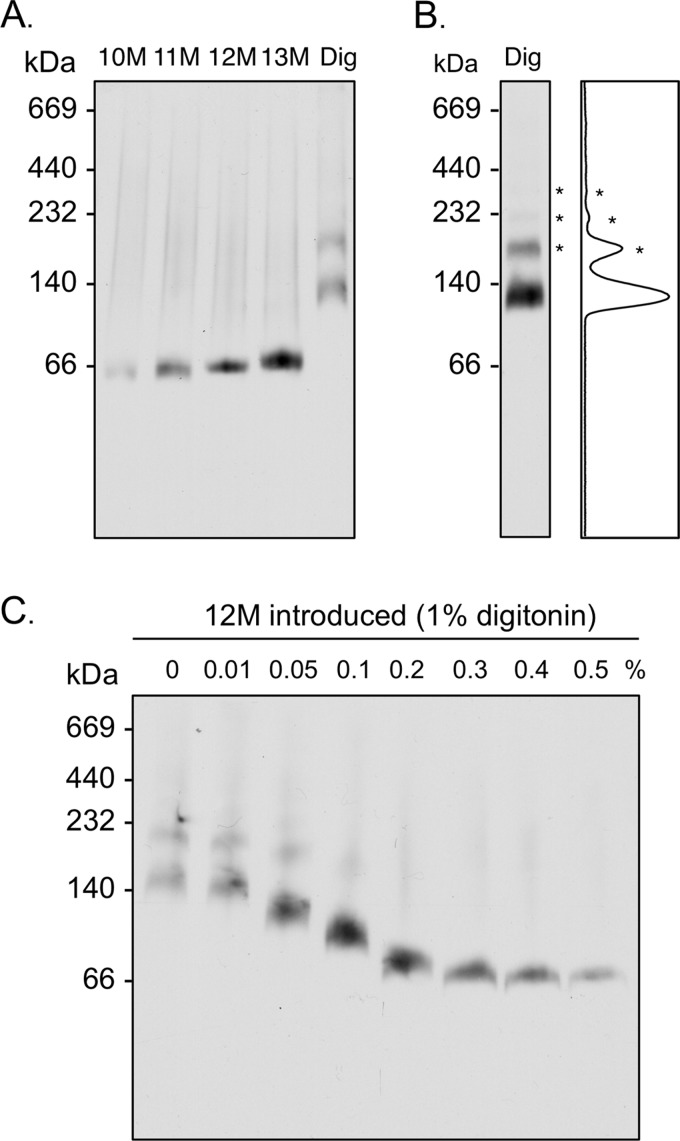
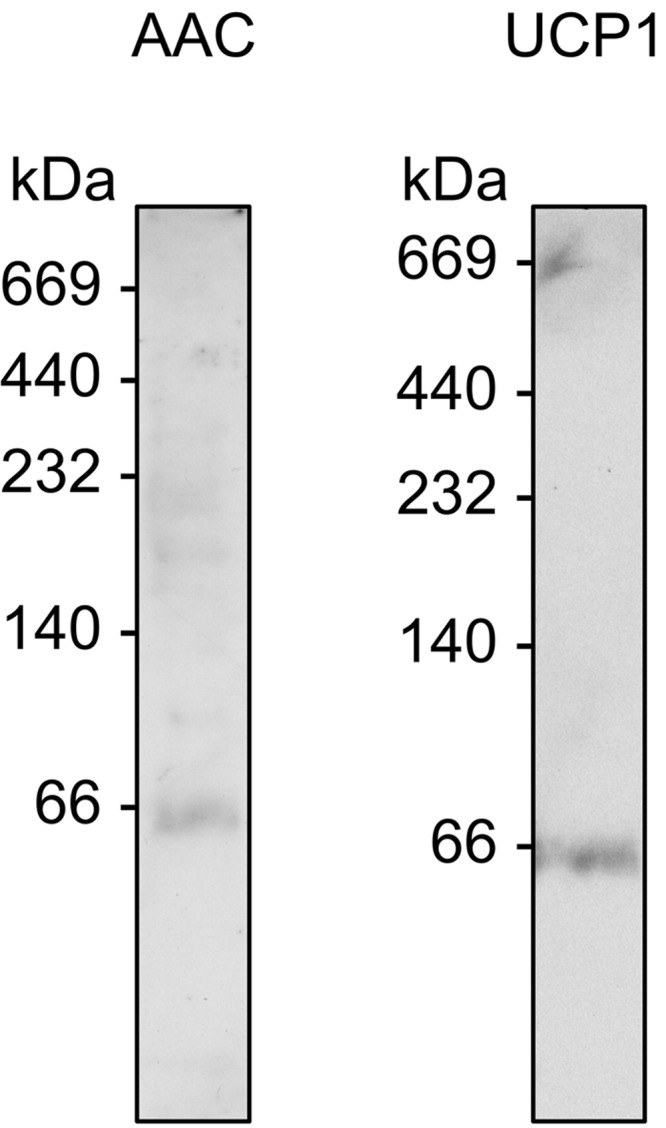
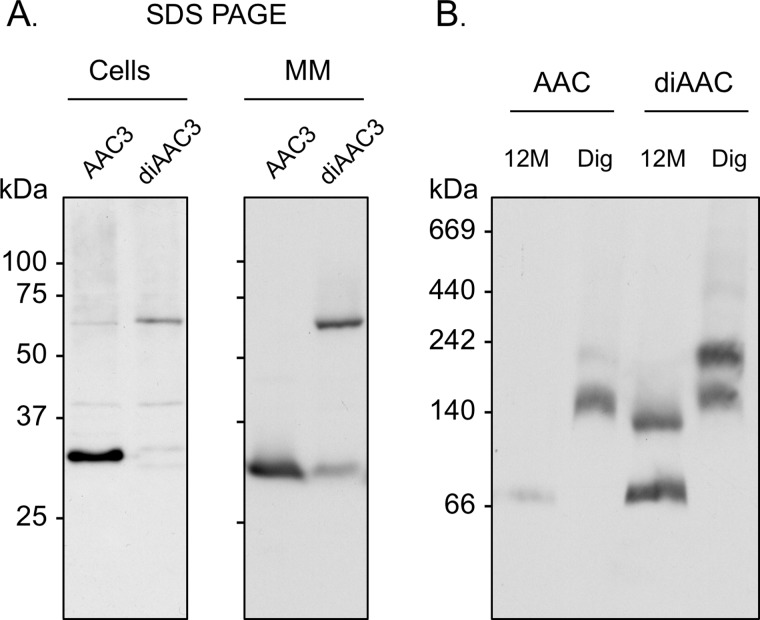
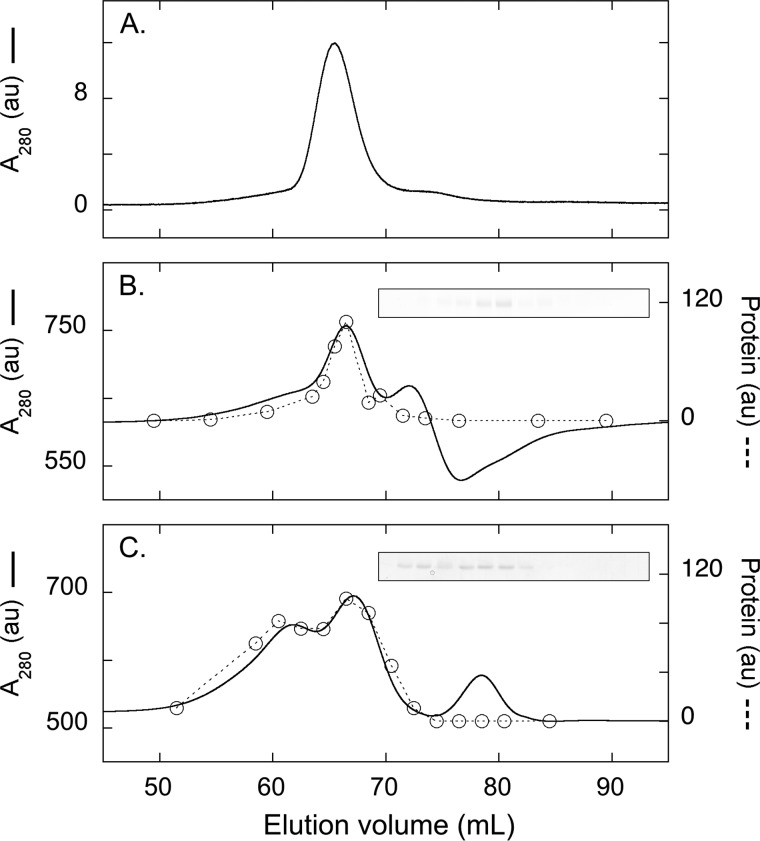
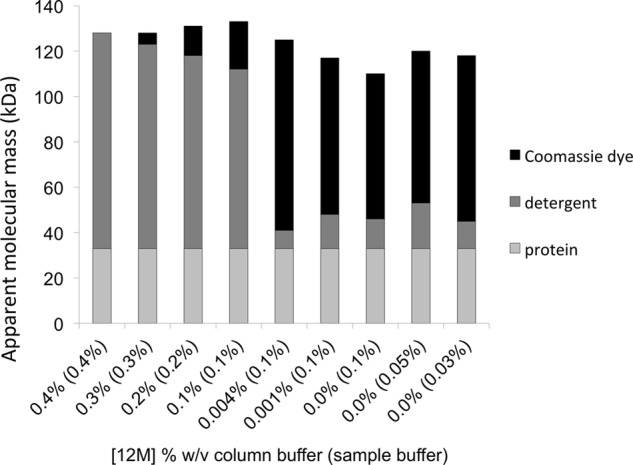
Blue native gel electrophoresis is a popular method for the determination of the oligomeric state of membrane proteins. Studies using this technique have reported that mitochondrial carriers are dimeric (composed of two ∼32-kDa monomers) and, in some cases, can form physiologically relevant associations with other proteins. Here, we have scrutinized the behavior of the yeast mitochondrial ADP/ATP carrier AAC3 in blue native gels. We find that the apparent mass of AAC3 varies in a detergent- and lipid-dependent manner (from ∼60 to ∼130 kDa) that is not related to changes in the oligomeric state of the protein, but reflects differences in the associated detergent-lipid micelle and Coomassie Blue G-250 used in this technique. Higher oligomeric state species are only observed under less favorable solubilization conditions, consistent with aggregation of the protein. Calibration with an artificial covalent AAC3 dimer indicates that the mass observed for solubilized AAC3 and other mitochondrial carriers corresponds to a monomer. Size exclusion chromatography of purified AAC3 in dodecyl maltoside under blue native gel-like conditions shows that the mass of the monomer is ∼120 kDa, but appears smaller on gels (∼60 kDa) due to the unusually high amount of bound negatively charged dye, which increases the electrophoretic mobility of the protein-detergent-dye micelle complex. Our results show that bound lipid, detergent, and Coomassie stain alter the behavior of mitochondrial carriers on gels, which is likely to be true for other small membrane proteins where the associated lipid-detergent micelle is large when compared with the mass of the protein.

Keywords: Detergent Micelle; Gel Electrophoresis; Membrane Proteins; Mitochondrial Transport; Protein Aggregation; Transporters.


Figures

FIGURE 1.
FIGURE 1.
The influence of detergent concentration and mitochondrial lipid on the apparent molecular mass of yeast AAC3 in blue native gels. Yeast mitochondrial membranes (200 μg of protein) or purified AAC3 protein (2 μg) were separated in 5–13% (w/v) polyacrylamide gels, and AAC3 was detected by Western analysis. A, the apparent molecular mass of AAC3 in 12M-solubilized mitochondrial membranes without (lane a) or with pretreatment with 80 μm CATR (lane b), when purified (lane c) or when purified and combined with the CATR-treated mitochondrial membranes (lane d). Accordingly, the antigen present in lane d is the sum of the antigen present in lanes b and c. All samples were prepared in 1% 12M. B, the apparent molecular mass of AAC3 in CATR-treated mitochondrial membranes prepared in 1–4% 12M. C, the apparent molecular mass of purified AAC3 in 1% 12M with 0–100% of the equivalent amount of mitochondrial lipid present in solubilized membrane samples reintroduced (see “Materials and Methods”). D and E, the average molecular masses (± S.D.) calculated from repeats of the gels in B and C (n = 3), respectively. The molecular masses (kDa) of protein standards are given to the left of each blot.
FIGURE 2.
FIGURE 2.
The influence of free detergent micelles on the migration of purified AAC3 in blue native gels. Yeast AAC3 was purified in alkyl maltoside detergents of varying micelle size (10–13M; see Ref. 27) and separated in 5–13% (w/v) polyacrylamide gels (4 μg of protein per lane) as described under “Materials and Methods.” A and B, the migration of purified AAC3 (prepared in detergent as indicated) and protein-free detergent micelles in blue native gels (right panels) with the position of AAC3 indicated by Western analysis (left panels). The densitometry profile is of lane 1 (0.2% 10M) of the blue native gel image. C, the migration of purified AAC3 and free detergent micelles in samples prepared with detergent at ∼30-fold the critical micelle concentration (2.61% 10M, 0.87% 11M, 0.26% 12M, and 0.05% 13M). D, the occurrence of minor higher mass AAC3 species observed occasionally with AAC3 prepared in 0.1–1% 12M (0.5% 12M shown). The molecular masses (kDa) of protein standards are given to the left of each gel or blot. Densitometry profiles (ImageJ software) of the relevant lanes are given to clarify the presence of multimeric species (*).
FIGURE 3.
FIGURE 3.
The apparent molecular mass of AAC3 in alkyl maltoside detergents and digitonin. Yeast mitochondrial membranes were prepared in detergent with 10-fold less protein present (cf. legend for Fig. 1) to minimize the influence of lipids in the protein-detergent micelle. Samples were separated in 6–18% (w/v) polyacrylamide gels, and AAC3 was detected by Western analysis. A and B, the apparent molecular mass of AAC3 in CATR-treated mitochondrial membranes (20 μg of protein) solubilized with 1% alkyl maltoside detergent (10–13M) or digitonin (Dig), as indicated. The occurrence of multimeric AAC3 species (*), observed with mitochondrial membranes solubilized in digitonin, is clarified in panel B with a densitometry profile (ImageJ software). C, the change in the apparent molecular mass of AAC3 in CATR-treated mitochondrial membranes solubilized in 1% digitonin with the introduction of 0–0.5% 12M. The molecular masses (kDa) of protein standards are given to the left of each blot.
FIGURE 4.
FIGURE 4.
The apparent molecular mass of native AAC and uncoupling protein-1 in blue native gels. Mitochondrial membranes from rat liver (AAC) and lamb brown adipose tissue (UCP1) were prepared in 1% 12M and separated in 6–18% (w/v) polyacrylamide gels as described in the legend for Fig. 3. For the detection of AAC3, mitochondrial membranes were pretreated with CATR. 20 μg of protein was loaded per lane. The migration of native AAC and uncoupling protein-1 was immuno-detected by Western analysis (see “Materials and Methods”). The molecular masses (kDa) of protein standards are given to the left of each blot.
FIGURE 5.
FIGURE 5.
The calibration of mitochondrial carrier migration with artificial covalently linked AAC dimers. A, whole yeast cells (20 μg of protein) or isolated mitochondrial membranes (MM; 7 μg of protein) containing AAC3 or a covalently linked AAC dimer (diAAC3) were separated by SDS-PAGE. B, CATR-treated mitochondrial membranes (20 μg of protein) containing AAC3 or a covalently linked AAC dimer (diAAC3) were separated in 6–18% (w/v) polyacrylamide gels as described in the legend for Fig. 3. AAC3 and diAAC3 were detected by Western analysis. The molecular masses (kDa) of protein standards are given to the left of each blot. Dig, digitonin.
FIGURE 6.
FIGURE 6.
Size exclusion chromatography of purified AAC3 under blue native gel-like conditions. A–C, elution profiles of purified AAC3 in 0.1% 12M (peak = 144 kDa) (A), 0.1% 12M with 0.02% Coomassie dye (peak = 133 kDa) (B), or 0.004% 12M with 0.02% Coomassie dye (peak 1 = 125 kDa and peak 2 = 185 kDa) (C). AAC3 was loaded in 0.1% 12M sample buffer supplemented with (B and C) or without (A) 0.02% Coomassie dye. The protein profile (dashed line) was quantified by densitometry of the eluted fractions on Coomassie-stained SDS gels (inset figures). See Table 1 and Fig. 7 for species composition. The column was calibrated with molecular mass standards (see “Materials and Methods”). au, arbitrary units.
FIGURE 7.
FIGURE 7.
The size and composition of AAC3 species under blue native gel-like conditions. Apparent molecular masses were estimated by size exclusion chromatography in the presence of 0.02% Coomassie dye and the indicated amount of 12M detergent. See Table 1 for details.

References

    1. Kunji E. R. (2004) The role and structure of mitochondrial carriers. FEBS Lett. 564, 239–244 - PubMed
    1. Palmieri F. (2008) Diseases caused by defects of mitochondrial carriers: a review. Biochim. Biophys. Acta 1777, 564–578 - PubMed
    1. Nedergaard J., Cannon B. (2010) The changed metabolic world with human brown adipose tissue: therapeutic visions. Cell Metab. 11, 268–272 - PubMed
    1. Pebay-Peyroula E., Dahout-Gonzalez C., Kahn R., Trézéguet V., Lauquin G. J., Brandolin G. (2003) Structure of mitochondrial ADP/ATP carrier in complex with carboxyatractyloside. Nature 426, 39–44 - PubMed
    1. Robinson A. J., Overy C., Kunji E. R. (2008) The mechanism of transport by mitochondrial carriers based on analysis of symmetry. Proc. Natl. Acad. Sci. U.S.A. 105, 17766–17771 - PMC - PubMed

Publication types

MeSH terms

LinkOut - more resources