. 2013 Jul 19;288(29):21458-21472.
doi: 10.1074/jbc.M112.444372. Epub 2013 Jun 6.

Altered cortical GABAA receptor composition, physiology, and endocytosis in a mouse model of a human genetic absence epilepsy syndrome

Affiliations

Altered cortical GABAA receptor composition, physiology, and endocytosis in a mouse model of a human genetic absence epilepsy syndrome

Chengwen Zhou et al. J Biol Chem. .

Abstract

Patients with generalized epilepsy exhibit cerebral cortical disinhibition. Likewise, mutations in the inhibitory ligand-gated ion channels, GABAA receptors (GABAARs), cause generalized epilepsy syndromes in humans. Recently, we demonstrated that heterozygous knock-out (Hetα1KO) of the human epilepsy gene, the GABAAR α1 subunit, produced absence epilepsy in mice. Here, we determined the effects of Hetα1KO on the expression and physiology of GABAARs in the mouse cortex. We found that Hetα1KO caused modest reductions in the total and surface expression of the β2 subunit but did not alter β1 or β3 subunit expression, results consistent with a small reduction of GABAARs. Cortices partially compensated for Hetα1KO by increasing the fraction of residual α1 subunit on the cell surface and by increasing total and surface expression of α3, but not α2, subunits. Co-immunoprecipitation experiments revealed that Hetα1KO increased the fraction of α1 subunits, and decreased the fraction of α3 subunits, that associated in hybrid α1α3βγ receptors. Patch clamp electrophysiology studies showed that Hetα1KO layer VI cortical neurons exhibited reduced inhibitory postsynaptic current peak amplitudes, prolonged current rise and decay times, and altered responses to benzodiazepine agonists. Finally, application of inhibitors of dynamin-mediated endocytosis revealed that Hetα1KO reduced base-line GABAAR endocytosis, an effect that probably contributes to the observed changes in GABAAR expression. These findings demonstrate that Hetα1KO exerts two principle disinhibitory effects on cortical GABAAR-mediated inhibitory neurotransmission: 1) a modest reduction of GABAAR number and 2) a partial compensation with GABAAR isoforms that possess physiological properties different from those of the otherwise predominant α1βγ GABAARs.

Keywords: Brain; Confocal Microscopy; Electrophysiology; Endocytosis; Endoplasmic Reticulum (ER); Epilepsy; GABA Receptors; Glycosylation; Membrane Trafficking; Western Blotting.


Figures
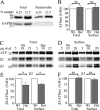
FIGURE 1.
FIGURE 1.
Hetα1KO reduced β2 but not β3 subunit expression. A, we treated wild type brain slices with a membrane-impermeable biotinylation reagent and purified the biotinylated proteins with immobilized neutravidin. Equivalent fractions (6.25 and 12.5%) of the total cortical lysates and neutravidin-purified material were analyzed on Western blots and stained for the integral membrane protein, α1 subunit, and the cytosolic protein, GAPDH (A). Biotinylation and neutravidin purification was selective for the α1 subunit, relative to GAPDH, with 45 ± 6% (n = 4) of the total α1 subunit and only 8 ± 2% (n = 5) of total GAPDH in the neutravidin-purified fraction. B, brain slices from wild type and Hetα1KO mice were biotinylated, and the cortical lysates were purified with immobilized neutravidin. Equal masses of total lysate and neutravidin-purified material were analyzed by Western blot. Hetα1KO did not significantly alter the total (108 ± 9%, n = 6) or surface (108 ± 7%, n = 4) expression of the loading control protein, the Na+/K+ ATPase α subunit. C–F, we analyzed 5, 10, and 15 μg of total (C) and 5, 10, and 20 μl of surface (D) cortical protein on Western blot and stained for the Na+/K+ ATPase α subunit (ATP) and the β2 and β3 subunits. Graphs (E and F) depict the relative amounts of ATPase-normalized β2 and β3 subunits from Hetα1KO mice compared with those of wild type. Hetα1KO reduced total and surface β2 subunit expression to 75 ± 8% (n = 8, p = 0.019) and 78 ± 5% (n = 8, p = 0.003) compared with wild type. Hetα1KO did not significantly change total (102 ± 8%, n = 6, p = 0.796) or surface (96 ± 5%, n = 8, p = 0.458) β3 subunit expression. Error bars, S.E.
FIGURE 2.
FIGURE 2.
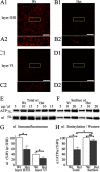
Hetα1KO reduced total α1 subunit expression and increased the relative surface α1 subunit expression. A–D, immunofluorescence images of α1 subunit staining in wild type (A and C) and Hetα1KO mice (B and D) in layers II/III (A and B) and VI (C and D) of the somatosensory cortex (white scale bar, 20 μm; n ≥ 8). The yellow boxed areas are displayed on a magnified scale below each image (A2–D2). Hetα1KO reduced α1 subunit expression in both layer II/III and layer VI with no apparent cell-to-cell variability in each microscopic image. Quantification of total α1 subunit expression is presented in the graph in G. In both genotypes of mice, there was greater α1 subunit expression in layer II/III than in layer VI (p < 0.001). Hetα1KO significantly reduced total α1 subunit expression in both cortical layers (p = 0.001), and there was no significant interaction between the effects of the genotype and the cortical layer on α1 subunit expression (p = 0.113, two-factor analysis of variance). E and F, biotinylation and Western blot experiments used to quantify the effects of Hetα1KO on surface and total α1 subunit expression. We analyzed 5, 10, and 15 μg of total (E) and 5, 10, and 20 μl of surface (F) protein on Western blot and stained for the GABAAR α1 subunit and Na+/K+ ATPase α subunit. Graphs (H) depict the relative amounts of ATPase-normalized α1 subunits from Hetα1KO mice compared with those of wild type. Hetα1KO caused a greater reduction in total (62 ± 8% wild type, n = 8) than in surface (89 ± 5% wild type, n = 5, p = 0.015) α1 subunit expression and thus increased the relative surface expression of the α1 subunit. Error bars, S.E.
FIGURE 3.
FIGURE 3.
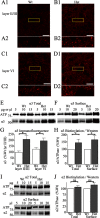
Hetα1KO increased the total and surface expression of the α3 subunit but not the α2 subunit. A–D, immunofluorescence images of α3 subunit staining in wild type (A and C) and Hetα1KO (B and D) mice in layers II/III (A and B) and VI (C and D) of the somatosensory cortex (white scale bar, 20 μm, n ≥ 6). The yellow boxed areas are displayed on a magnified scale below each image (A2–D2). Quantification of the total α3 subunit staining (G) showed that Hetα1KO increased α3 subunit expression (p < 0.001) in both layer II/III and layer VI and that there was no effect of the cortical layer on α3 subunit expression (p = 0.720, two-factor analysis of variance). We performed biotinylation assays and Western blots to quantify the amount of total and surface α3 subunit. We analyzed 5, 10, and 15 μg of total (E) and 5, 10, and 20 μl of surface (F) cortical protein on Western blot and stained for the α3 subunit as well as the ATPase α subunit. The graph (H) depicts the relative amount of ATPase-normalized α3 subunit from Hetα1KO mice compared with those of wild type. Hetα1KO increased total α3 subunit expression to 138 ± 18% (n = 10, p = 0.016) and surface α3 subunit expression to 174 ± 24% (n = 7, p = 0.020). Biotinylation assays and Western blots (I–J) demonstrated that Hetα1KO did not significantly change total (105 ± 4%, n = 4, p = 0.389) or surface (117 ± 7%, n = 5, p = 0.081) α2 subunit expression. Error bars, S.E.
FIGURE 4.
FIGURE 4.
Hetα1KO altered the association of α1 and α3 subunits. A, COS-7 cells were left untransfected or were transfected with α1β2γ2 or α3β2γ2 GABAAR (n = 3). Cellular lysates were immunoprecipitated (IP) with either the α1 or α3 subunit, and the products were analyzed by Western blot. The blots were probed with the anti-α1 subunit antibody (green) and the anti-α3 subunit antibody (red). Neither the α1 nor α3 antibody immunoprecipitated proteins from untransfected cells. The α1 subunit antibody but not the anti-α3 subunit antibody immunoprecipitated the α1 subunit protein from the cells expressing α1β2γ2 receptors, and the α3 subunit antibody but not the α1 subunit antibody immunoprecipitated α3 subunit protein from the cells expressing α3β2γ2 receptors. B, cortical lysates from wild type mice were immunoprecipitated with the mouse α1 subunit antibody (Ms α1), the rabbit α3 subunit antibody (Rb α3), or control immunoglobulin from nonimmunized mice (Ms cont) or rabbits (Rb cont). Immunoprecipitated material was analyzed by Western blot and stained for the α1 (green) or α3 (red) subunit. The anti-α1 and anti-α3 subunit antibodies coimmunoprecipitated α1 and α3 subunits, but neither the mouse nor rabbit control immunoglobulin immunoprecipitated either subunit. C–F, total protein from wild type and Hetα1KO cortices was immunoprecipitated with antibodies directed against the α1 or α3 subunits. Immunoprecipitated material (5, 10, and 20 μl) was analyzed on Western blot, which was stained with both the α1 and α3 subunit antibodies (C and D). Immunoprecipitation using the anti-α1 subunit antibody (C and E) recovered 68 ± 11% as much α1 subunit from Hetα1KO cortex as compared with wild type cortex (n = 5, p = 0.039), and, when normalized to recovered α1 subunit, co-immunoprecipitated 227 ± 20% as much α3 subunit from Hetα1KO cortex as from wild type cortex (n = 4, p = 0.008). Immunoprecipitation using the anti-α3 subunit antibody (D and F) recovered 173 ± 19% as much α3 subunit from Hetα1KO as from wild type cortex (n = 5, p = 0.020) and co-immunoprecipitated 63 ± 8% as much normalized α1 subunit from Hetα1KO as from wild type cortex (n = 4, p = 0.008). Error bars, S.E.
FIGURE 5.
FIGURE 5.
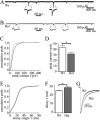
Hetα1KO decreased the mIPSC peak amplitudes and altered the time course of current kinetics in layer VI pyramidal neurons. A and B depict, respectively, representative mIPSC tracings from cortical layer VI pyramidal wild type (n = 11, black) and Hetα1KO (n = 10, gray) neurons. The insets on the traces depict mIPSCs on an expanded time scale to demonstrate the time course of current decay. C and E, cumulative histograms summarizing the individual mIPSC absolute peak current amplitudes and decay time constants (single τ). Compared with wild type (black solid line), Hetα1KO (gray dashed line) reduced the peak current amplitudes and increased the time course of current decay (K-S test, p < 0.001). We calculated the average amplitude and decay constant for each neuron individually. The bar graphs (D and F) depict the mean of the averaged amplitude and τ values and demonstrate that Hetα1KO reduced the absolute mean peak amplitude (wild type, −43 ± 4.1 pA; Hetα1KO, −32 ± 2.5 pA; p = 0.032) and prolonged the mean decay time constant (wild type, 24 ± 0.9 ms; Het, 27 ± 1.3 ms; p = 0.034). We averaged the mIPSC traces separately for each neuron with normalized amplitudes, calculated the weighted time constants of current decay (τw), and depicted specimen traces in G. Hetα1KO increased the weighted time constant (τw) from 12.7 ± 1.0 to 17.4 ± 1.6 ms (p = 0.024). Error bars, S.E.
FIGURE 6.
FIGURE 6.
Hetα1KO altered the responses of cortical pyramidal neurons to benzodiazepine agonists. We recorded eIPSCs in the absence (black) and presence (gray) of the benzodiazepine agonists, diazepam (1 μm; A–C) and zolpidem (100 nm; D–F) in wild type (A and D) and Hetα1KO (B and E) layer VI pyramidal neurons. Diazepam increased the eIPSC amplitude in both wild type (133 ± 6.8%, n = 6, p = 0.005 versus 100%) and Hetα1KO neurons (190 ± 5.1%, n = 5, p = 0.006 versus 100%) but had a greater effect on Hetα1KO than wild type neurons (C, p = 0.007 wild type versus Hetα1KO). Zolpidem increased eIPSC amplitudes in wild type (127 ± 4.1%, n = 8, p < 0.001 versus 100%) but not Hetα1KO neurons (105 ± 3.1%; n = 7; p = 0.130 versus 100%, p = 0.001 versus wild type). Error bars, S.E.
FIGURE 7.
FIGURE 7.
Hetα1KO did not increase α3 subunit mRNA expression or α1 subunit mRNA driven from the wild type allele. We extracted total mRNA from wild type and Hetα1KO cortices and performed quantitative real-time PCR with probes that amplified the α1 (A) and α3 (B) subunits as well as actin, the endogenous control. Hetα1KO reduced α1 subunit mRNA expression to 52 ± 7% that of wild type (n = 6; p = 0.001 versus 100%, p = 0.750 versus 50%) and did not significantly change α3 subunit mRNA expression (90 ± 7%, n = 6, p = 0.230 versus 100%). Error bars, S.E.
FIGURE 8.
FIGURE 8.
Hetα1KO did not alter the fraction α1 subunits associated with the ER. We transfected COS-7 cells with α1β2γ2 cDNA (positive control) and prepared homogenates from the COS-7 cells as well as from cortices of wild type and Hetα1KO (Het) mice. We left the protein homogenates undigested (U), or digested them with either endo-H (H) or PNGase F (F). We analyzed the digestion products by Western blot and stained for the α1 subunit. In both COS-7 cells and cortical lysates, PNGase F digestion reduced the molecular mass of α1 subunit from 50 to 46 kDa, consistent with the removal of two glycans. Endo-H digestion of α1 subunit expressed in COS-7 cells produced a 46-kDa digestion product (ER fraction) and a 48-kDa product. Endo-H digestion of α1 subunit from wild type or Hetα1KO cortex produced only the 48-kDa product (n = 5).
FIGURE 9.
FIGURE 9.
Inhibition of dynamin-mediated endocytosis increased wild type, but not Hetα1KO mIPSC amplitudes. We tested the effects of 80 μm dynasore (A and B) and 50 μm P4 peptide (C), two inhibitors of dynamin-mediated endocytosis, on mIPSCs from wild type and Hetα1KO layer VI pyramidal neurons. For dynasore, we recorded for a 5-min base-line period before adding the dynasore to the external recording solution. P4 peptide experiments were performed with P4 peptide in the internal solution of the patch pipette. Both recordings lasted 25 min. For both dynasore and P4 peptide, we averaged the mIPSC amplitudes in 1-min blocks and normalized them to the average amplitude during the first minute of recording (baseline). A, representative mIPSCs during the base line and 20 min after the addition of dynasore. We plotted the base line-normalized mIPSC amplitudes in B and C and compared the effects of the drugs at 25 min of recording (insets). Both dynasore (n ≥ 5) and P4 peptide (n = 5) increased mIPSC peak amplitudes in wild type (□, white), but not Hetα1KO (○, gray; n = 6) neurons. For dynasore, wild type mIPSC peak amplitudes were 126 ± 9.4% at 25 min compared with base line, but for Hetα1KO neurons, amplitudes at 25 min were 87 ± 7.9% that of base line (p = 0.014). For P4 peptide, wild type mIPSC peak amplitudes were 142 ± 12% at 25 min compared with base line, but Hetα1KO amplitudes at 25 min were 96 ± 5.5% compared with base line (p = 0.009). Error bars, S.E.
FIGURE 10.
FIGURE 10.
The effects of Hetα1KO on cortical GABAAR expression, composition, and endocytosis. Here, we summarize our findings and propose a model by which Hetα1KO alters GABAAR expression, composition, and endocytosis. For wild type (A) and Hetα1KO (B) neurons, we depict the plasma membrane (top), cytosol (middle), endoplasmic reticulum (bottom), α1 subunits (green), and α3 subunits (red). For simplicity, we grouped the partnering β and γ subunits as a single blue symbol, did not differentiate between lysosomal or proteosomal degradation, and did not depict the Golgi. 1, Hetα1KO reduces functional α1 subunit mRNA but does not affect α3 subunit mRNA. 2, therefore, Hetα1KO reduces α1 subunit translated and inserted into ER, and thus a greater fraction of α1 subunits assemble into hybrid α1α3βγ pentamers and a greater fraction of α3 subunits incorporate into α3βγ pentamers. Because fewer α1 subunits are able to compete with α3 subunits for binding partners, more α3 subunits incorporate into functional receptors and fewer undergo ER-associated degradation. Consistent with our glycosylation experiments, the ER does not contain a substantial pool of GABAAR. 3, there is a small reduction in total and surface GABAAR. In addition, although the total number of α1 subunits is reduced, redistribution of GABAAR from the cytoplasm increases the ratio of surface/total α1 subunits with a greater fraction in α1α3βγ pentamers. 4, reduced cell surface endocytosis increases relative surface GABAAR expression and decreases GABAAR in early endosomes, an effect that reduces insertion into plasma membrane when endocytosis is inhibited with dynasore or P4 peptide (5).

Similar articles

Cited by

References

    1. Rannals M. D., Kapur J. (2011) Homeostatic strengthening of inhibitory synapses is mediated by the accumulation of GABAA receptors. J. Neurosci. 31, 17701–17712 - PMC - PubMed
    1. Shu Y., Hasenstaub A., McCormick D. A. (2003) Turning on and off recurrent balanced cortical activity. Nature 423, 288–293 - PubMed
    1. Lüttjohann A., Zhang S., de Peijper R., van Lijtelaar G. (2011) Electrical stimulation of the epileptic focus in absence epileptic WAG/Rij rats. Assessment of local and network excitability. Neuroscience 188, 125–134 - PubMed
    1. Badawy R. A., Jackson G. D. (2012) Cortical excitability in migraine and epilepsy. A common feature? J. Clin. Neurophysiol. 29, 244–249 - PubMed
    1. Fedi M., Berkovic S. F., Macdonell R. A., Curatolo J. M., Marini C., Reutens D. C. (2008) Intracortical hyperexcitability in humans with a GABAA receptor mutation. Cereb. Cortex 18, 664–669 - PubMed

Publication types

MeSH terms