. 2013 Aug 8;122(6):912-21.
doi: 10.1182/blood-2013-01-478321. Epub 2013 Jun 6.

Ribosomal and hematopoietic defects in induced pluripotent stem cells derived from Diamond Blackfan anemia patients

Affiliations

Ribosomal and hematopoietic defects in induced pluripotent stem cells derived from Diamond Blackfan anemia patients

Loïc Garçon et al. Blood. .

Abstract

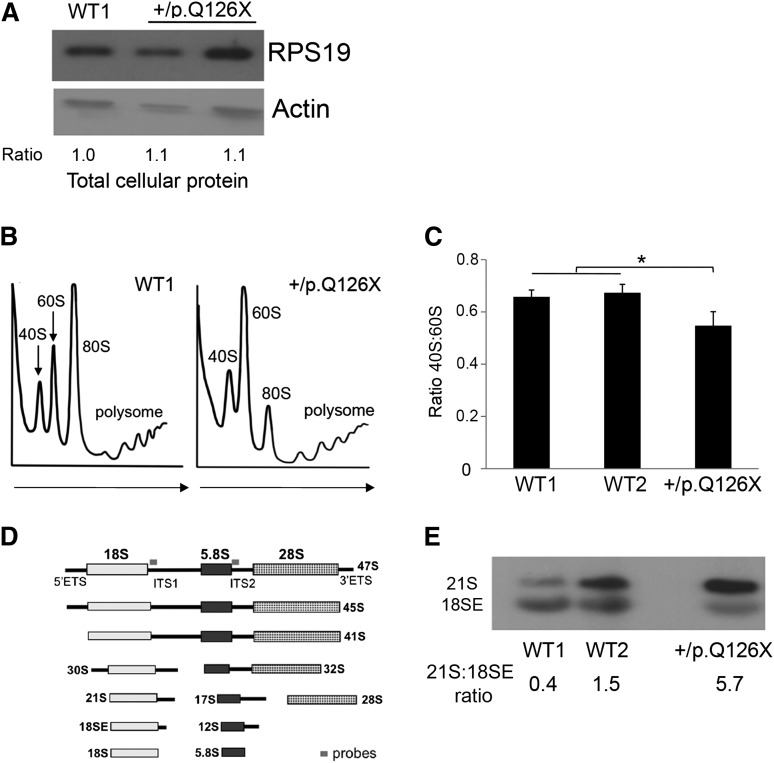
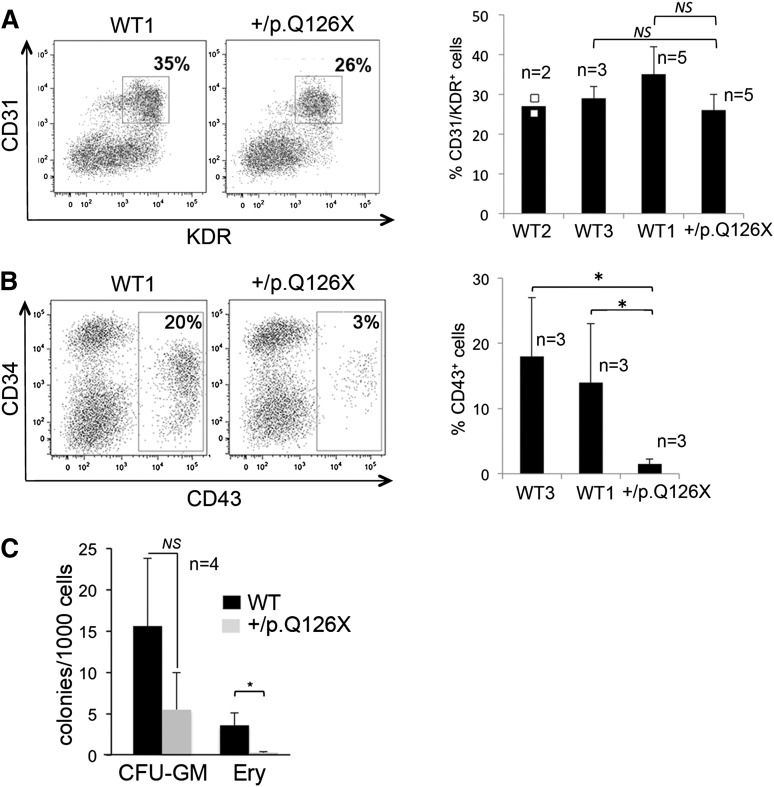
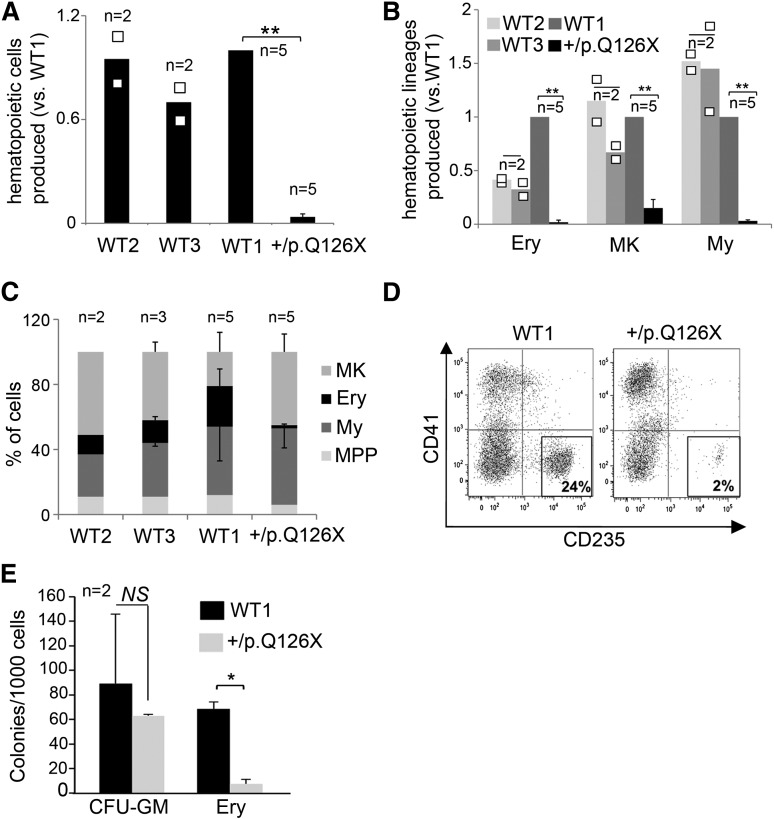
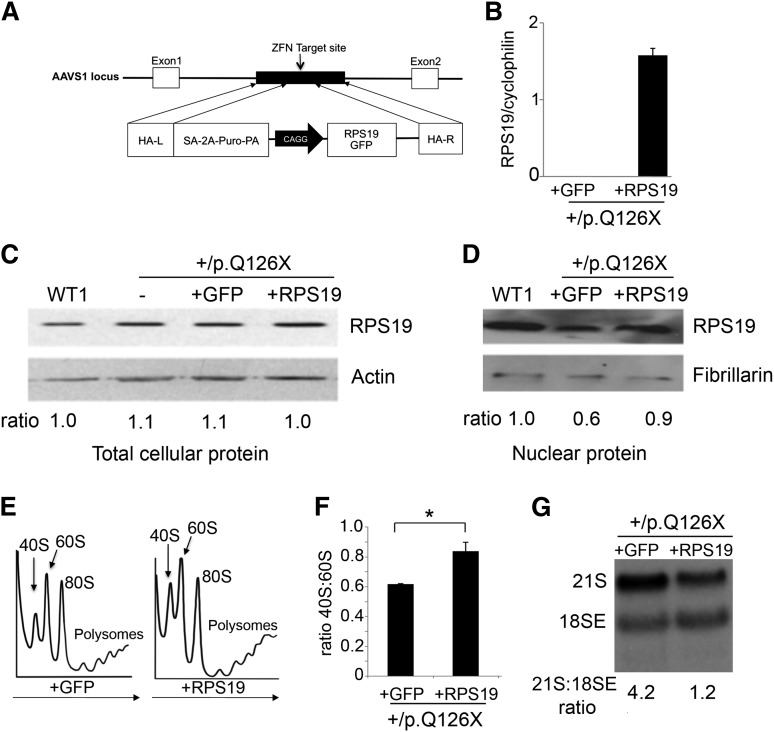
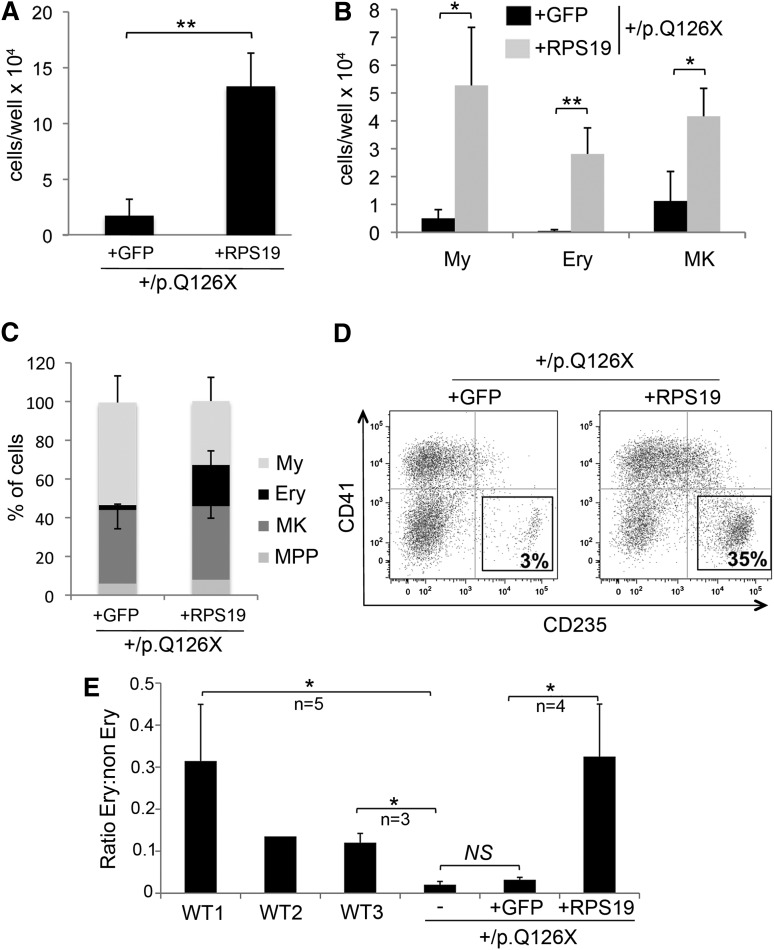
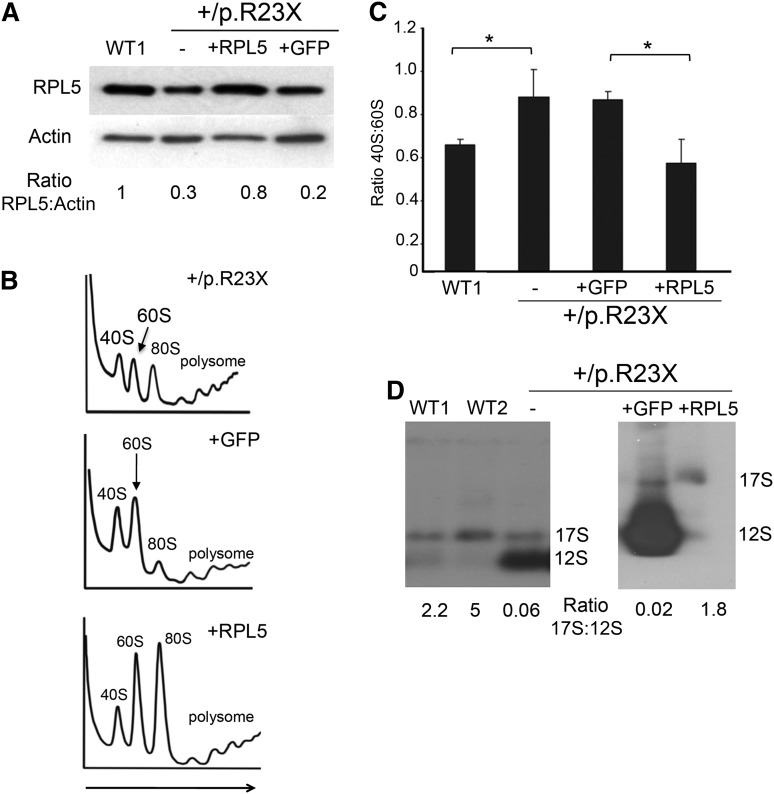
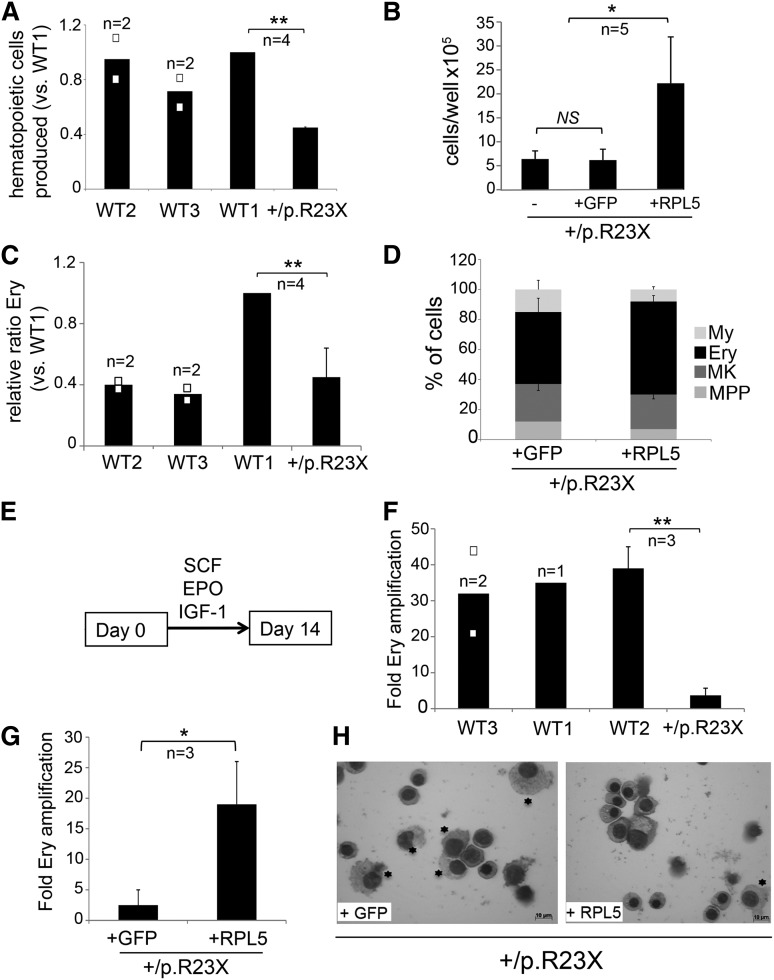
Diamond Blackfan anemia (DBA) is a congenital disorder with erythroid (Ery) hypoplasia and tissue morphogenic abnormalities. Most DBA cases are caused by heterozygous null mutations in genes encoding ribosomal proteins. Understanding how haploinsufficiency of these ubiquitous proteins causes DBA is hampered by limited availability of tissues from affected patients. We generated induced pluripotent stem cells (iPSCs) from fibroblasts of DBA patients carrying mutations in RPS19 and RPL5. Compared with controls, DBA fibroblasts formed iPSCs inefficiently, although we obtained 1 stable clone from each fibroblast line. RPS19-mutated iPSCs exhibited defects in 40S (small) ribosomal subunit assembly and production of 18S ribosomal RNA (rRNA). Upon induced differentiation, the mutant clone exhibited globally impaired hematopoiesis, with the Ery lineage affected most profoundly. RPL5-mutated iPSCs exhibited defective 60S (large) ribosomal subunit assembly, accumulation of 12S pre-rRNA, and impaired erythropoiesis. In both mutant iPSC lines, genetic correction of ribosomal protein deficiency via complementary DNA transfer into the "safe harbor" AAVS1 locus alleviated abnormalities in ribosome biogenesis and hematopoiesis. Our studies show that pathological features of DBA are recapitulated by iPSCs, provide a renewable source of cells to model various tissue defects, and demonstrate proof of principle for genetic correction strategies in patient stem cells.


Figures

Figure 1
Figure 1
Ribosome biogenesis defects in RPS19+/p.Q126X iPSCs. (A) Western blot showing RPS19 protein in RPS19+/p.Q126X iPSCs and a WT (WT1) control line. Lane 2 represents the mutant iPSC line examined throughout this manuscript. Lane 3 represents an iPSC line that did not fulfill all of the pluripotency criteria and therefore was not examined further. Ratio of RPS19:actin determined by densitometry is shown relative to the value for the WT1 sample, which was assigned an arbitrary value of 1.0. (B) Sucrose gradient polysome profiles showing reduced 40S:60S ratio in RPS19+/p.Q126X iPSCs compared with a WT control line. Arrows show direction of the sucrose gradient from less to more dense. (C) Histogram summarizing 3 independent polysome profiling experiments examining RPS19+/p.Q126X iPSCs and 2 different WT lines. The 40S:60S ratio was significantly reduced in the mutated clone (0.55 vs 0.66, *P < .05). (D) Diagram showing rRNA maturation and Northern blot probes complementary to ITS1 (for the 40S unit) and ITS2 (for the 60S unit), used in Figures 1E, 4G, and 6D. The probe sequences are shown in supplemental Table 3. (E) Northern blot analysis of iPSCs using the ITS1 probe. RPS19+/p.Q126X iPSCs exhibit relative accumulation of 21S pre-rRNA compared with WT iPSCs. The 21S:18SE pre-rRNA ratios determined by densitometry scanning is shown at the bottom of the panels. ITS, internal transcribed spacer.
Figure 2
Figure 2
Defective hematopoiesis by RPS19+/p.Q126X iPSCs. (A) Four-day-old EBs were disaggregated and analyzed by flow cytometry for CD31+/KDR+ cells, which represent prehematopoietic mesoderm. A representative experiment is shown on the left. The combined results of multiple experiments analyzing 3 WT control lines and RPS19+/p.Q126X iPSCs are shown on the right. The black bars in the graph represent mean values. For iPSC lines examined in 3 or more independent experiments, the error bars show SD. For iPSC lines examined twice, individual data points from each experiment are shown as open squares. (B) Eight-day-old EBs were disaggregated and analyzed by flow cytometry for CD43+ cells, which represent the first hematopoietic progenitors to emerge from ESC or iPSC differentiation. A representative experiment is shown on the left. The combined results of 3 independent experiments are shown on the right. *P < .05. (C) Hematopoietic progenitor assay. EBs were dissociated at day 8 of differentiation and seeded into methylcellulose containing EPO, IL-3, SCF, and GM-CSF. CFU-GM and Ery colonies were enumerated 7 to 9 days after plating. *P < .05; NS (P = .17); n = 4 separate experiments, each in triplicate. CFU-GM, colony forming unit-granulocyte macrophage; NS, not significant.
Figure 3
Figure 3
RPS19+/p.Q126X iPSCs exhibit panhematopoietic defects with the Ery lineage most strongly affected. (A) Relative ratio of hematopoietic cells released by WT and RPS19+/p.Q126X EBs at day 14 of differentiation. Cell numbers are normalized to those produced by the WT1 clone, which was analyzed consistently in all experiments. Cultures containing roughly equal numbers of EBs were analyzed. WT and RPS19+/p.Q126X EBs were of similar size. **P = .002; n = 5 separate experiments. (B) Quantification of hematopoietic lineages in the experiment from panel A. MK (CD41+/CD235), Ery (CD41+/CD235+), My (CD41/CD235, CD45+) cells were identified by flow cytometry in WT and RPS19+/p.Q126X EB cultures at day 14 of differentiation. **P < .01; n = 5 separate experiments. (C) Relative frequency (%) of each lineage present in day 14 EB cultures represented in experiments from panels A and B. The proportion of Ery cells was decreased in cultures derived from RPS19+/p.Q126X iPSCs (RPS19+/p.Q126X vs WT1: 2% vs 19%, n = 5, P < .01). MPP refers to the CD41+/CD235+ primitive multipotential progenitor population that arises transiently in day 7 to 8 EB cultures and disappears gradually as the cells differentiate into mature lineages., (D) Representative flow cytometry analysis showing reduced proportion of Ery cells (CD235+/CD41) produced by RPS19+/p.Q126X iPSCs compared with WT1 control in day 14 EB cultures. (E) Hematopoietic progenitor assay. CD43+ progenitors released from day 8 EBs were seeded in triplicate into methylcellulose containing EPO, IL-3, SCF, and GM-CSF. CFU-GM and Ery colonies were enumerated 7 to 9 days after plating. The Ery progenitors were reduced in the RPS19+/p.Q126X samples compared with WT1 control (*P < .05). The bars in the graphs (A-B) represent mean values. For iPSC lines examined in 3 or more independent experiments, the error bars show SD. For lines examined twice, individual data points from each experiment are shown as open squares. MK, megakaryocytic; My, myeloid.
Figure 4
Figure 4
Genetic rescue of RPS19+/p.Q126X iPSCs restores 40S ribosomal subunit biogenesis. (A) Gene correction strategy. The constitutively active AAVS1 “safe harbor” locus is shown on the top line and the targeting construct is shown below. cDNA expression cassettes driving expression of WT RPS19 or GFP cDNAs under the chicken actin promoter (CAGG) were inserted by zinc finger-mediated homologous recombination into intron 1 of AAVS1. HA, homologous arms left (L) and right (R); SA-2A-Puro-PA, puromycin drug resistance cassette. (B) Quantitative RT-PCR analysis of AAVS1-targeted iPSCs using primers specific for transgenic RPS19 cDNA. Expression was detected specifically in RPS19+/p.Q126X iPSCs after heterozygous integration of the RPS19 cDNA into the AAVS1 locus. RPS19 expression is normalized to the cyclophilin expression level. (C) Western blot showing RPS19 protein in whole-cell lysates of WT1, RPS19+/p.Q126X parental iPSCs (designated as “ – ”) and RPS19+/p.Q126X clones with AAVS1-integrated GFP or RPS19 transgenes. The ratio of RPS19:actin determined by densitometry is shown relative to the WT1 sample, which was assigned an arbitrary value of 1.0. (D) Western blot showing RPS19 protein in nuclear extracts of WT and RPS19+/p.Q126X clones with AAVS1-integrated GFP or RPS19 transgenes. The RPS19:fibrillarin ratios determined by densitometry are shown relative to the WT1 sample, which was assigned an arbitrary value of 1.0. (E) Representative polysome profiles in RPS19+/p.Q126X iPSC subclones with GFP or WT RPS19 cDNA expression cassettes integrated into the AAVS1 locus. Arrows show direction of the sucrose gradient from less to more dense. (F) Summary of 3 independent experiments quantifying the 40S:60S ribosome subunit ratio in RPS19+/p.Q126X iPSC subclones with GFP or WT RPS19 cDNA expression cassettes integrated into the AAVS1 locus. Experiments were performed as illustrated in panel E. *P < .05. (G) Northern blot analysis using the ITS1 probe (see Figure 1D) in RPS19+/p.Q126X iPSCs with GFP or RPS19 cDNA introduced into the AAVS1 locus. RPS19 rescue of RPS19+/p.Q126X iPSCs specifically alleviates impaired processing of 21S pre-rRNA. The ratios of 21S:18SE RNAs determined by densitometry scanning are shown.
Figure 5
Figure 5
Gene rescue by RPS19 restores hematopoiesis in RPS19+/p.Q126X iPSCs. (A) Hematopoietic cells released from EBs derived from RPS19+/p.Q126X iPSC subclones with GFP or RPS19 cDNAs integrated into the AAVS1 locus. **P = .002; n = 4 independent experiments. (B) Hematopoietic cells released from EBs, as shown in panel A, were analyzed by flow cytometry for hematopoietic lineage markers, as described in Figure 3B. **P < .01 for Ery; *P < .05 for MK and My; n = 4 independent experiments. (C) Analysis of data from panel B showing relative production of different hematopoietic lineages in the RPS19+/p.Q126X iPSC sublines with GFP or RPS19 cDNA transgenes. Note that erythropoiesis is selectively enhanced in the RPS19-rescued cells (% CD235+: 21 vs 2.5, P = .009); n = 4 independent experiments. (D) Representative flow cytometry analysis showing the percentage of CD235+ Ery cells produced in differentiation cultures of RPS19+/p.Q126X iPSC subclones with GFP or RPS19 cDNA transgenes. (E) The relative proportion of Ery cells produced by day 14 EBs derived from 3 WT iPSC lines, RPS19+/p.Q126X parental iPSCs (designated as “–”) and its subclones containing GFP or RPS19 cDNAs integrated into the AAVS1 locus. The variable proportions of erythroblasts observed between the 3 WT lines represents reproducible differences in hematopoietic potential among different iPSC clones. Note that erythropoiesis is restored in RPS19+/p.Q126X iPSCs by RPS19 cDNA, but not by GFP cDNA. *P < .05, n = 4 independent experiments comparing RPS19+/p.Q126X + GFP and RPS19+/p.Q126X + RPS19 clones.
Figure 6
Figure 6
RPL5+/p.R23X iPSCs exhibit ribosomal defects that are rescued by gene correction. (A) Western blot for RPL5 protein in WT1 and RPL5+/p.R23X iPSCs (first 2 lanes). Gene-corrected and control sublines were generated by introducing WT RPL5 or GFP cDNA, respectively, into the AAVS1 locus of RPL5+/p.R23X iPSCs (lanes 3 and 4). Ratio of RPL5:actin analyzed by densitometry is shown relative to the WT1 clone, which is assigned an arbitrary value of 1.0. (B) Polysome profiling of RPL5+/p.R23X iPSCs and sublines with GFP or WT RPL5 cDNAs integrated into the AAVS1 locus. A polysome profile of a WT iPSC line is shown in Figure 1B. Arrow shows direction of the sucrose gradient from less to more dense. (C) Summary of 3 polysome profiling experiments showing increased ratio of 40S:60S ribosomal subunits in RPL5-haploinsufficient iPSCs (lanes 2 and 3), compared with WT (lane 1) or RPL5-rescued RPL5+/p.R23X iPSCs (lane 4). *P < .05. (D) Northern blot analysis with the ITS2 probes (see Figure 1D) showing accumulation of 12S pre-rRNA molecules in RPL5+/p.R23X iPSCs (designated as “–” in the last lane of the left panel) compared with WT cells. This defect is ameliorated in RPL5+/p.R23X iPSCs expressing WT RPL5 cDNA, but not in those expressing GFP cDNA (right). The ratios of 17S:12S rRNAs determined by densitometry scanning are shown at the bottom.
Figure 7
Figure 7
Defective erythropoiesis in RPL5-haploinsufficient iPSCs is restored by gene correction. (A) Hematopoietic cells released from EBs generated by RPL5+/p.R23X and 3 different WT lines at day 14 of differentiation. Cultures contained roughly equal numbers of EBs that were of similar size. **P < .01; n = 4 independent experiments performed in parallel between WT1 and RPL5+/p.R23X, 2 of them included WT2 and WT3. All the results are shown as a ratio relative to WT1, which was used as an internal standard in every experiment and is assigned an arbitrary value of 1. (B) Hematopoietic cells released by EBs from RPL5+/p.R23X (designated as “–”) and gene-corrected (+GFP control and +RPL5) iPSCs at day 14 of differentiation. Cultures contained roughly equal numbers of EBs that were of similar size. *P < .05. All experiments were performed in parallel. n = 5 independent experiments. (C) Ery cells released by day 14 EBs from RPL5+/p.R23X and WT iPSCs. Results are shown as relative ratio to WT1 present in each experiment and used as an internal standard. RPL5+/p.R23X EBs released fewer Ery cells than WT1 EBs (P < .01, n = 4), but not WT2 or WT3 EBs. The increased proportion of erythroblasts produced by WT1 iPSCs reflects clonal variability in Ery potential that we observe consistently between different WT iPSC lines. (D) Relative frequency (%) of each hematopoietic lineage present in day 14 EB cultures represented in experiment from panel B, as determined by flow cytometry according to Figure 3C. The proportion of Ery cells in WT RPL5-rescued RPL5+/p.R23X iPSCs was not significantly increased compared with nonrescued clones; n = 5 independent experiments. (E) Hematopoietic cells (2 × 10⁵) released by 14-day-old EBs from WT and RPL5+/p.R23X iPSCs were incubated with the Ery cytokine combination EPO, SCF, and IGF-1 and cultured for 14 days. (F) Expansion of iPSC-derived Ery progenitors after 14 days in liquid culture according to the protocol described in panel E. Data are shown for 3 WT control cell lines and the RPL5+/p.R23X clone (**P < .01). (G) Expansion of Ery progenitors derived from RPL5+/p.R23X iPSCs with GFP or WT RPL5 cDNAs, assessed according to the strategy described in panels E and F. Correction of RPL5 haploinsufficiency increased Ery expansion by about sevenfold (*P < .05). (H) May Grünwald-Giemsa–stained cells from experiment in panel G at day 14 of culture. The cultures derived from RPL5+/p.R23X + GFP iPSCs express a greater proportion of myeloid cells (*) compared with cultures derived from RPL5+/p.R23X + RPL5 iPSCs, which are predominantly Ery (right panel). Images were obtained with a Zeiss Axioskope 2 microscope, Axiocam camera, and AxioVision 4.8 software (Carl Zeiss). The black bars in the graphs (A,C,F) represent mean values. For iPSC lines examined in 3 or more independent experiments, the error bars show SD. For iPSC lines examined twice, individual data points from each experiment are shown as open squares.

Comment in

Similar articles

Cited by

References

    1. Ball S. Diamond Blackfan anemia. Hematology Am Soc Hematol Educ Program. 2011;2011:487-491. - PubMed
    1. Gazda HT, Zhong R, Long L, et al. RNA and protein evidence for haplo-insufficiency in Diamond-Blackfan anaemia patients with RPS19 mutations. Br J Haematol. 2004;127(1):105–113. - PubMed
    1. Devlin EE, Dacosta L, Mohandas N, Elliott G, Bodine DM. A transgenic mouse model demonstrates a dominant negative effect of a point mutation in the RPS19 gene associated with Diamond-Blackfan anemia. Blood. 2010;116(15):2826–2835. - PMC - PubMed
    1. Boria I, Garelli E, Gazda HT, et al. The ribosomal basis of Diamond-Blackfan Anemia: mutation and database update. Hum Mutat. 2010;31(12):1269–1279. - PMC - PubMed
    1. Ellis SR, Gleizes PE. Diamond Blackfan anemia: ribosomal proteins going rogue. Semin Hematol. 2011;48(2):89–96. - PubMed

Publication types

MeSH terms