

Automated quantitation of the posterior scleral flattening and optic nerve protrusion by MRI in idiopathic intracranial hypertension
- PMID: 23744692
- PMCID: PMC7965211
- DOI: 10.3174/ajnr.A3600
Automated quantitation of the posterior scleral flattening and optic nerve protrusion by MRI in idiopathic intracranial hypertension
Abstract
Background and purpose: Subjective determination of the posterior sclera flattening and optic nerve protrusion in MRI is challenging because of the 3D nature of the globe morphology. This study aims to develop and compare quantitative measures of globe flattening and optic nerve protrusion with subjective rating, and assess relationships with papilledema grade and intraocular and CSF pressures.
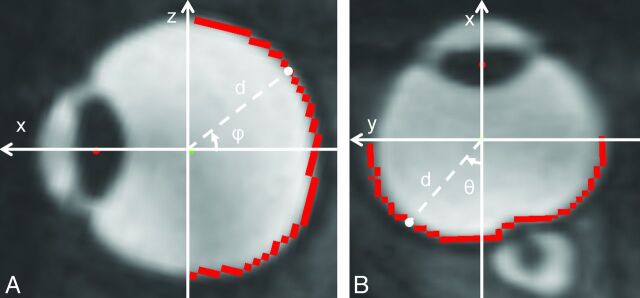
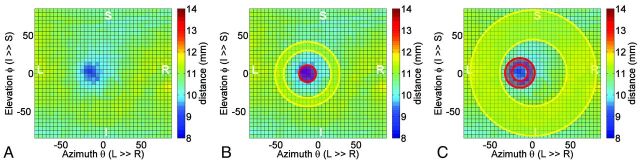
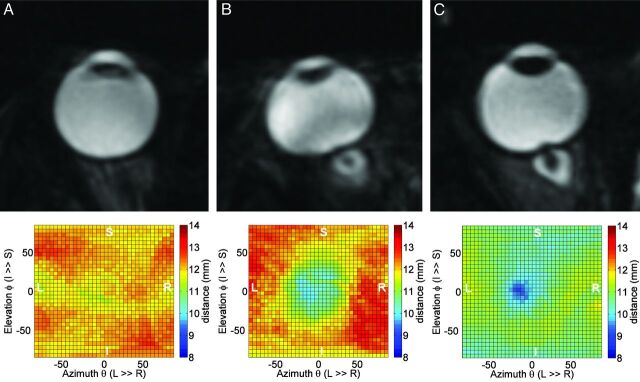
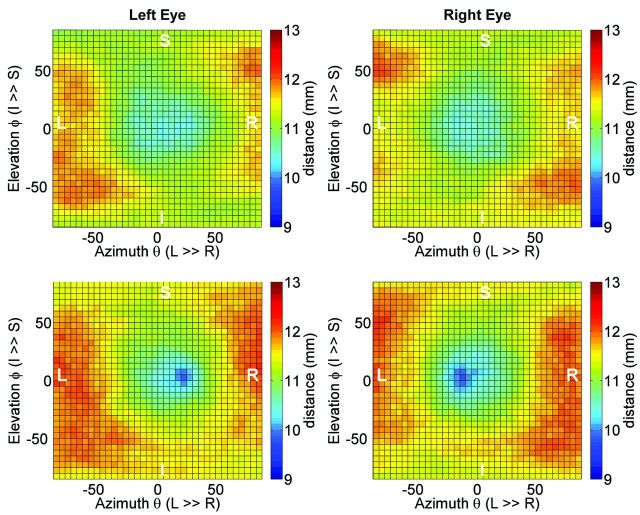
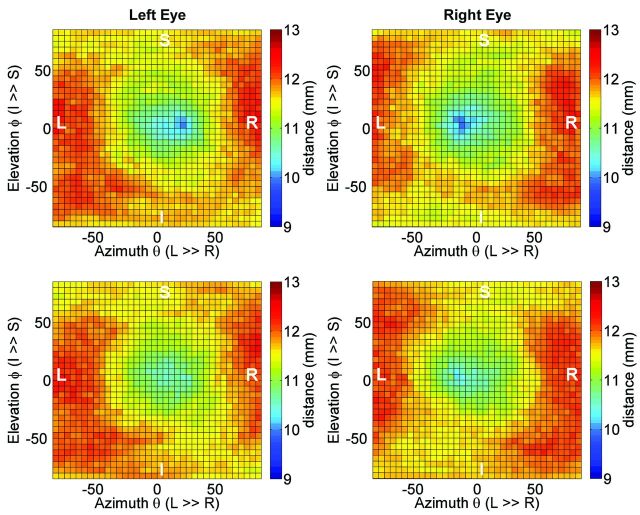
Materials and methods: Data of 34 globes from 7 overweight female patients with idiopathic intracranial hypertension and 6 age- and weight-matched healthy female control subjects were assessed, as well as a subcohort of 4 of the patients with idiopathic intracranial hypertension who underwent follow-up MR imaging 2 weeks after lumbar puncture and initiation of treatment with acetazolamide. MR imaging examination included a 3D CISS sequence on 1.5T and 3T scanners with 0.6-mm isotropic resolution. Subjective ratings of globe flattening were obtained by experienced and inexperienced readers. Quantitative measures of globe flattening, nerve protrusion, and maximal deformation were derived by use of a 2D map of the distances from the globe center to the posterior wall.
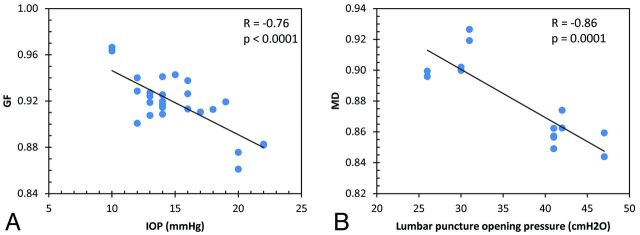
Results: Contingency coefficients for globe flattening agreements with subjective rating by the experienced and inexperienced readers were 0.72 and 0.56, respectively. Mean values of the 3 deformation measures were significantly poorer in the idiopathic intracranial hypertension group, with nerve protrusion demonstrating the strongest difference (P = .0002). Nerve protrusion was most strongly associated with papilledema grade with a contingency coefficient of 0.74 (P = .01), whereas globe flattening was negatively correlated with intraocular pressure (R = -0.75, P < .0001). Maximal deformation was negatively associated with CSF opening pressure (R = -0.86, P = .0001). After treatment, only the changes in nerve protrusion and maximal deformation were significant.
Conclusions: Automated measures of globe deformation improve reliability over subjective rating. Of the 2 globe deformation measures, nerve protrusion had the strongest predictive value for papilledema grade and had the highest sensitivity for assessment of treatment efficacy in idiopathic intracranial hypertension.
Figures
References
-
- Brodsky MC, Vaphiades M. Magnetic resonance imaging in pseudotumor cerebri. Ophthalmology 1998;105:1686–93 - PubMed
-
- Agid R, Farb RI, Willinsky RA, et al. Idiopathic intracranial hypertension: the validity of cross-sectional neuroimaging signs. Neuroradiology 2006;48:521–27 - PubMed
-
- Mader TH, Gibson CR, Pass AF, et al. Optic disc edema, globe flattening, choroidal folds, and hyperopic shifts observed in astronauts after long-duration space flight. Ophthalmology 2011;118:2058–69 - PubMed
Publication types
MeSH terms
Grants and funding
LinkOut - more resources
Full Text Sources
Other Literature Sources
Medical