. 2013 Jun 7;340(6137):1220-3.
doi: 10.1126/science.1234012.

Structural systems biology evaluation of metabolic thermotolerance in Escherichia coli

Affiliations

Structural systems biology evaluation of metabolic thermotolerance in Escherichia coli

Roger L Chang et al. Science. .

Abstract

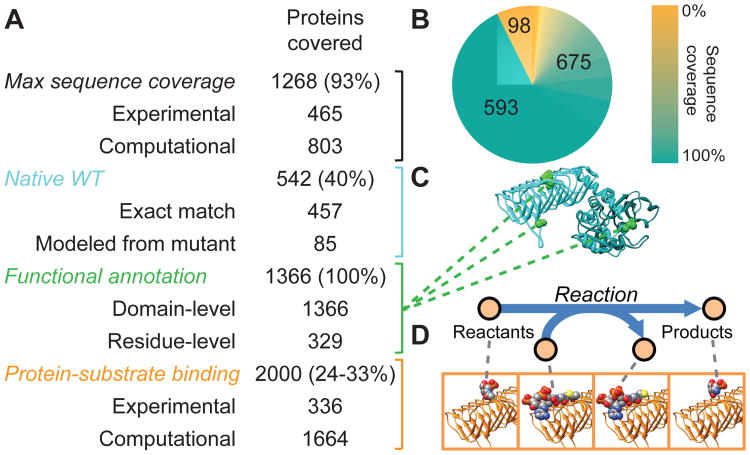
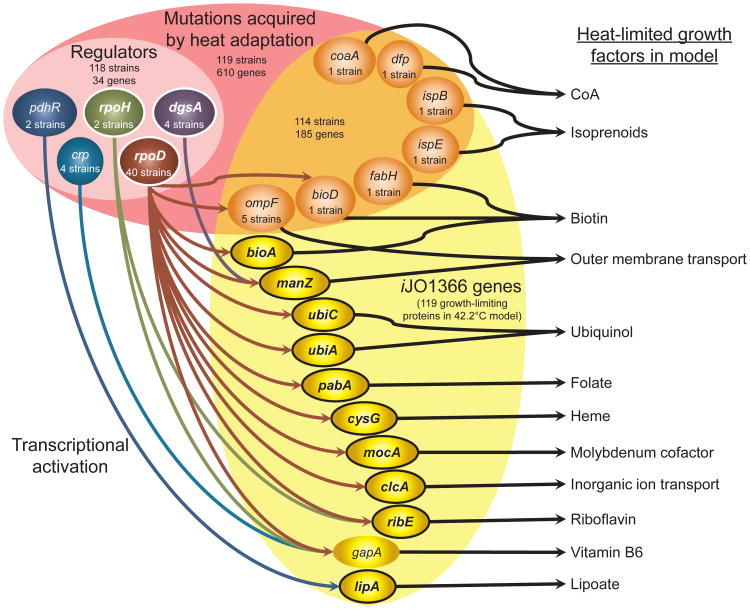
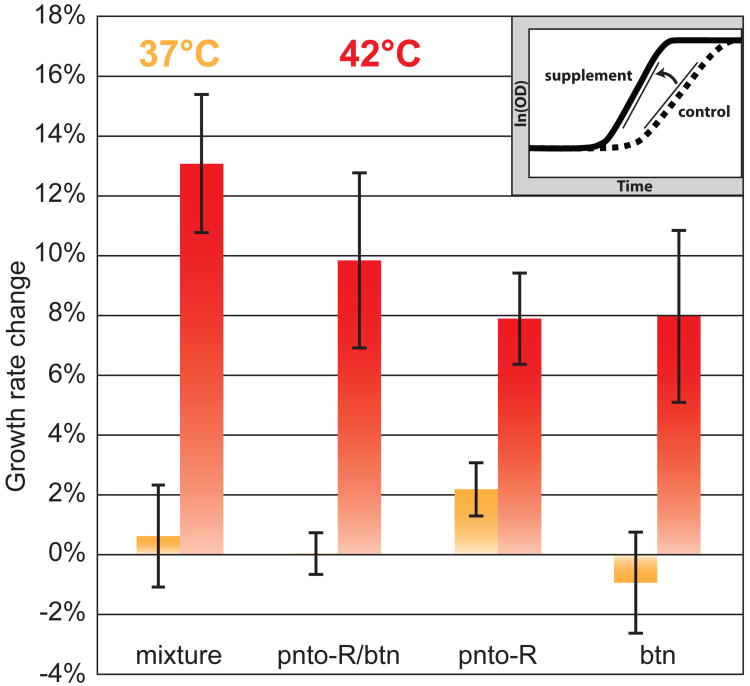
Genome-scale network reconstruction has enabled predictive modeling of metabolism for many systems. Traditionally, protein structural information has not been represented in such reconstructions. Expansion of a genome-scale model of Escherichia coli metabolism by including experimental and predicted protein structures enabled the analysis of protein thermostability in a network context. This analysis allowed the prediction of protein activities that limit network function at superoptimal temperatures and mechanistic interpretations of mutations found in strains adapted to heat. Predicted growth-limiting factors for thermotolerance were validated through nutrient supplementation experiments and defined metabolic sensitivities to heat stress, providing evidence that metabolic enzyme thermostability is rate-limiting at superoptimal temperatures. Inclusion of structural information expanded the content and predictive capability of genome-scale metabolic networks that enable structural systems biology of metabolism.


Figures

Fig. 1
Fig. 1
Properties of the E. coli metabolic model integrated with protein structures (A) The E. coli GEM-PRO model provides maximal amino acid sequence coverage, native WT structures, functional annotation, and protein-substrate binding for proteins included in iJO1366. Percentages are out of 1366 total proteins, except for the percentage of protein-substrate binding pairs, which is out of an estimated total between 6144 and 8448 such pairs. (B) The distribution of maximum amino acid sequence coverage of proteins by structures included in the GEM-PRO. Numbered wedges indicate the number of proteins with 0%, 100%, or partial sequence coverage. (C) Example of a native WT structure included in the GEM-PRO. Green highlighted residues denote annotated functional sites. (D) Protein-substrate binding is structurally represented as the pairwise interactions between each protein and the reactants or products of the catalyzed metabolic reaction.
Fig.2
Fig.2
Simulated and experimental growth rates as a function of temperature (A) Growth rates relative to the maximum are depicted under each condition. Growth was simulated on minimal medium with glucose (circles) or experimentally measured (diamonds) on Davis minimal medium (DM) with glucose (29), lysogeny broth (LB) (11), or brain heart infusion (BHI) broth (30). The shaded region highlights the temperature range in which the model best predicts relative growth rates. (B) Simulated growth rates relative to maximum WT growth rate are shown for the WT strain, a strain with critical temperatures of the four most growth-limiting proteins at 42.2°C adjusted for maximum activity at that temperature, and a strain with critical temperatures of all growth-limiting proteins at 42.2°C adjusted for maximum activity at that temperature. The gray regions indicate the predicted most growth-limiting proteins and pathways for each phase of WT growth.
Fig.3
Fig.3
Mechanisms predicted to confer thermotolerance are summarized for heat-adapted E. coli strains. The total number of heat-adapted strains and mutated genes is given and also noted for the regulatory and metabolic subsets of mutated genes. Only regulators acting upon metabolic genes both predicted to lead to thermosensitivity and with heat-induced transcription in WT are depicted, except for crp. Only metabolic genes predicted to lead to thermosensitivity and either mutated in the set of evolved strains or both activated by depicted regulators and with heat-induced transcription in WT are depicted, except for gapA. Encircled, bolded genes show heat-induced transcription in WT. Predicted growth factors limited by heat-dependent decreases in protein activity are indicated at right.
Fig.4
Fig.4
Changes in specific growth rate upon supplementation relative to a no supplement control are depicted in orange for 37°C and red for 42°C. Error bars show standard deviations with n = 3 for each condition. The inset graph illustrates how growth rate changes were computed by comparing the maximum slopes of growth curves between the control and supplement condition. Mixture: combination of all 6 supplements, pnto-R: pantothenate, btn: biotin.

References

    1. Van Derlinden E, Bernaerts K, Van Impe JF. Dynamics of Escherichia coli at elevated temperatures: effect of temperature history and medium. J Appl Microbiol. 2008 Feb;104:438. - PubMed
    1. Korkegian A, Black ME, Baker D, Stoddard BL. Computational thermostabilization of an enzyme. Science. 2005 May 6;308:857. - PMC - PubMed
    1. Fischer CR, Klein-Marcuschamer D, Stephanopoulos G. Selection and optimization of microbial hosts for biofuels production. Metab Eng. 2008 Nov;10:295. - PubMed
    1. Beltrao P, Kiel C, Serrano L. Structures in systems biology. Curr Opin Struct Biol. 2007 Jun;17:378. - PubMed
    1. Zhang Y, et al. Three-dimensional structural view of the central metabolic network of Thermotoga maritima. Science. 2009 Sep 18;325:1544. - PMC - PubMed

Publication types

MeSH terms

Substances

Associated data