. 2013 May 14;25(9):1664-1672.
doi: 10.1021/cm400106k.

Mesoscale phase distribution in single particles of LiFePO4 following lithium deintercalation

Affiliations

Mesoscale phase distribution in single particles of LiFePO4 following lithium deintercalation

Ulrike Boesenberg et al. Chem Mater. .

Abstract

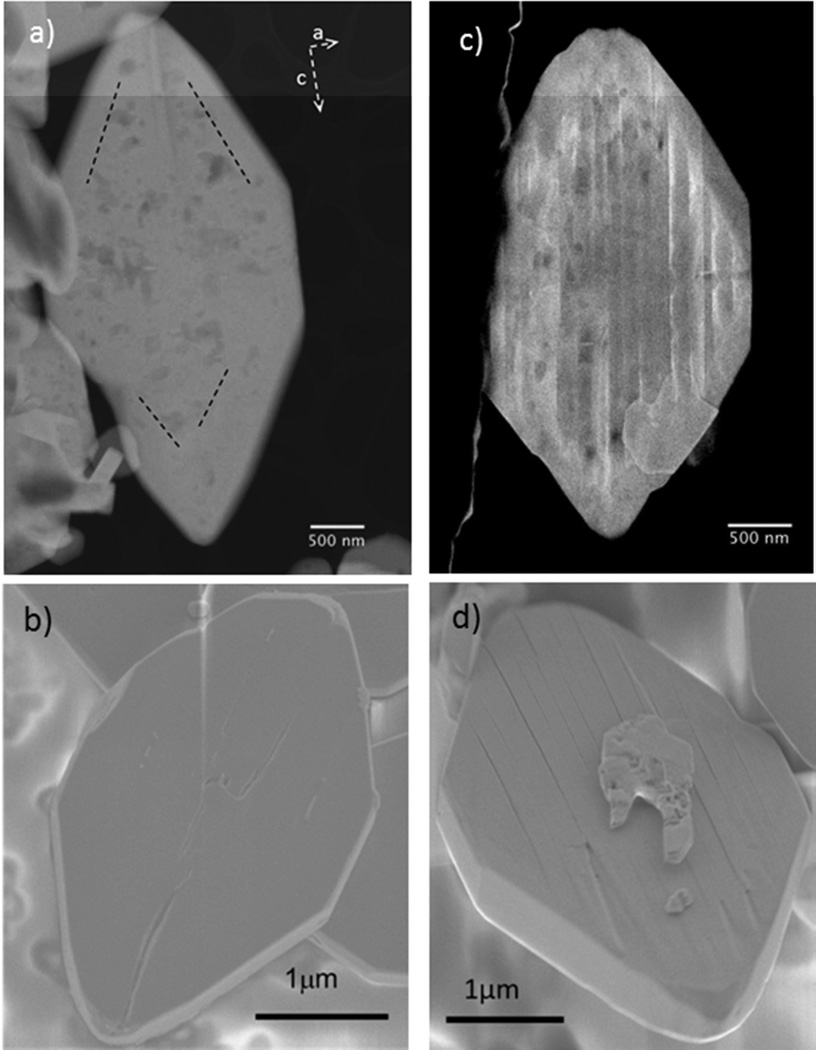
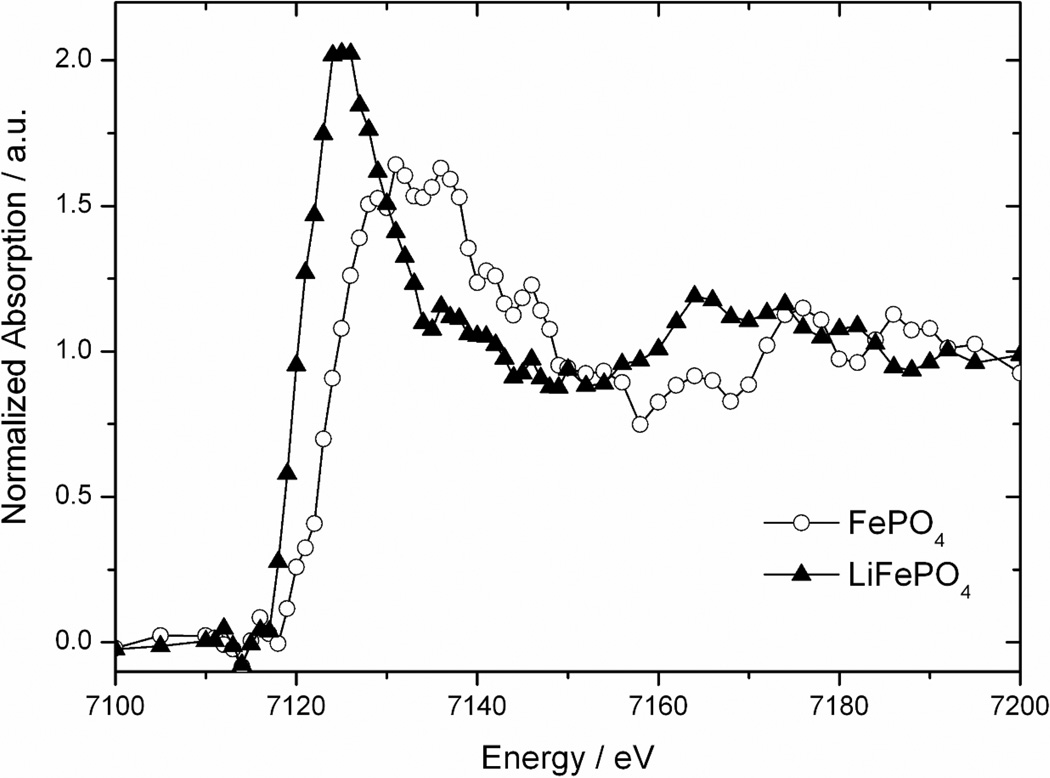
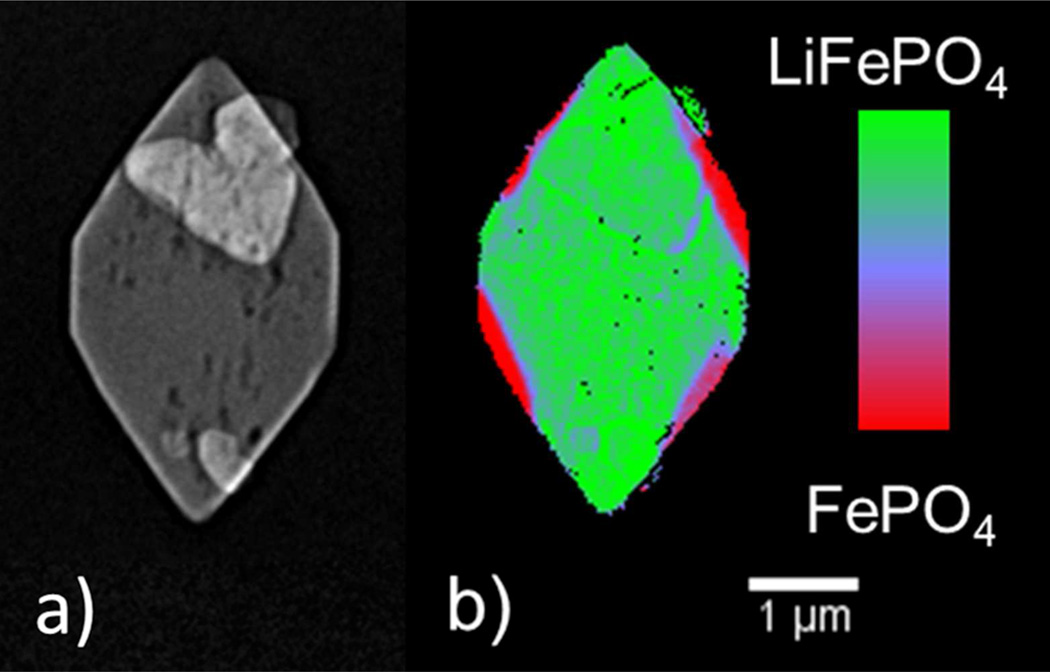
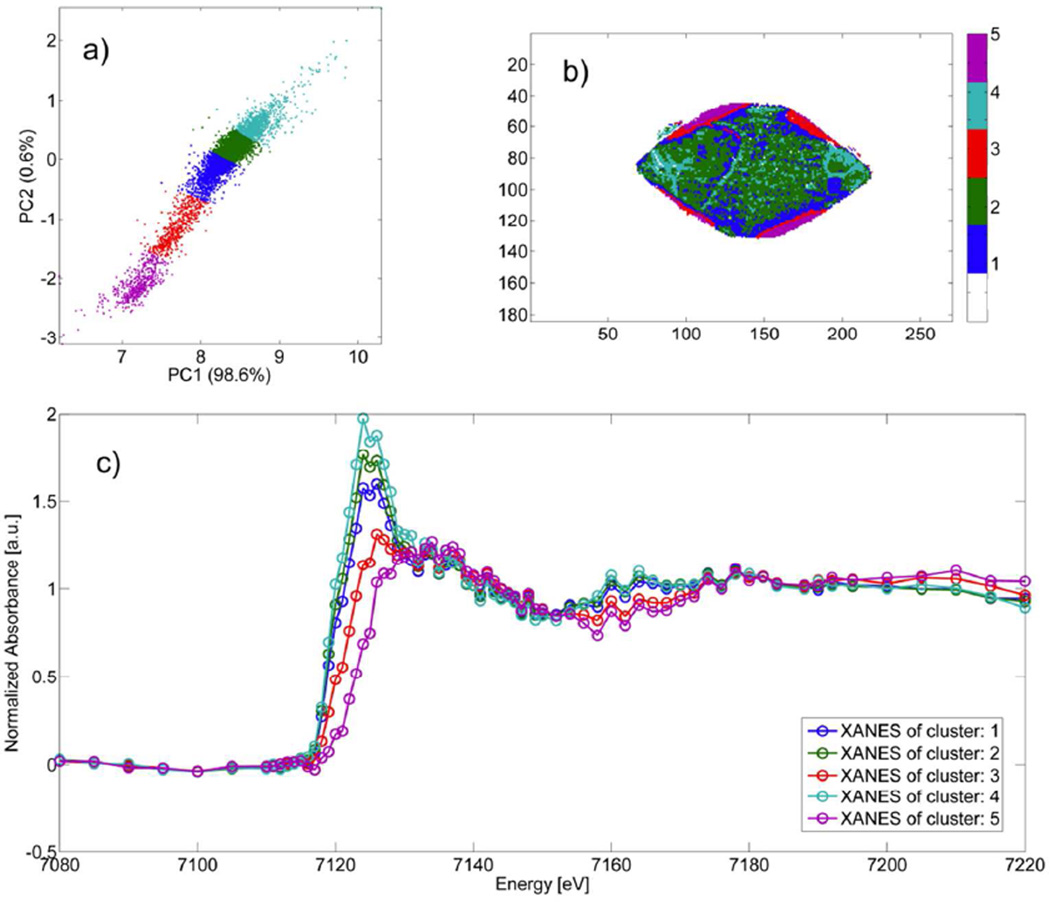
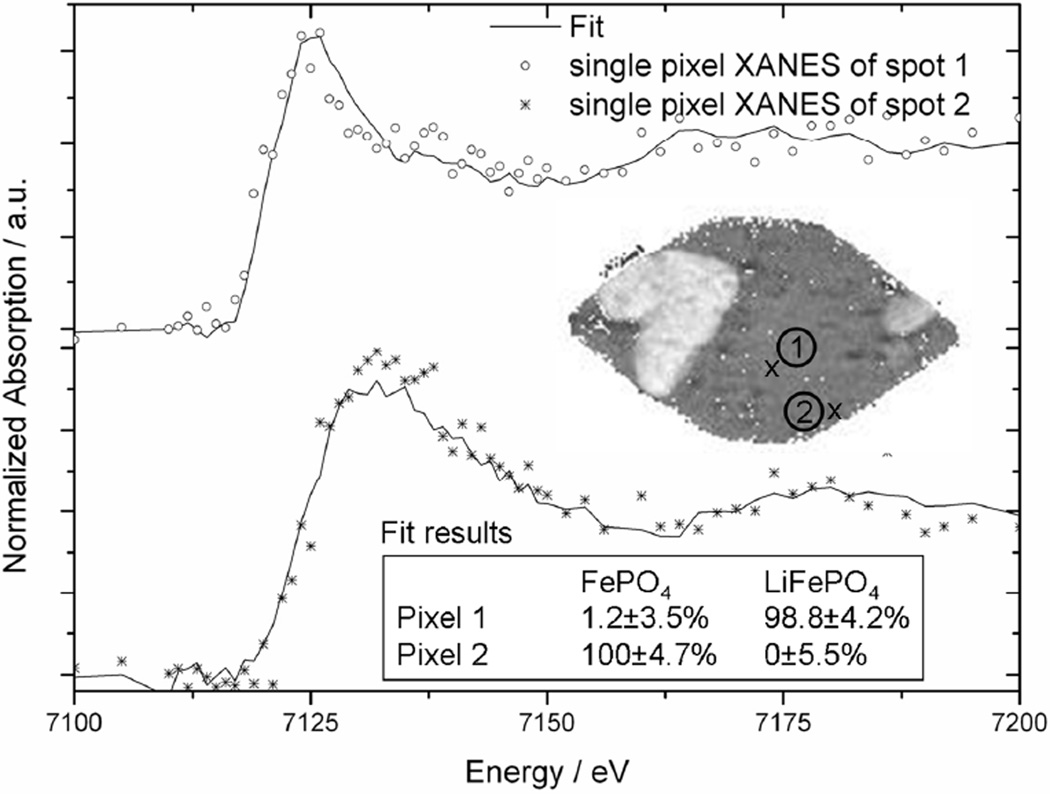
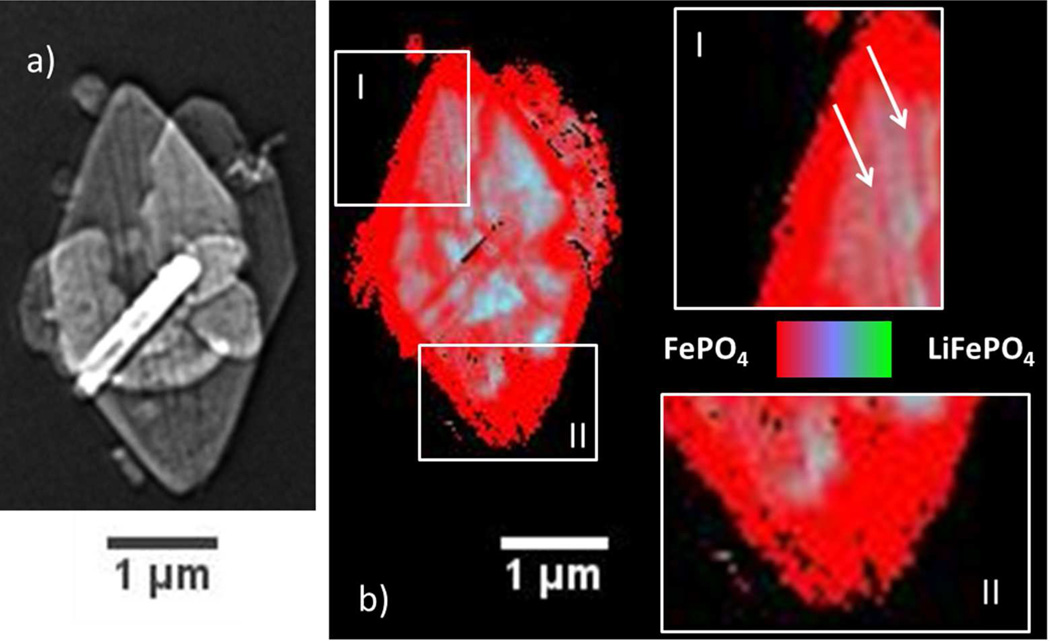
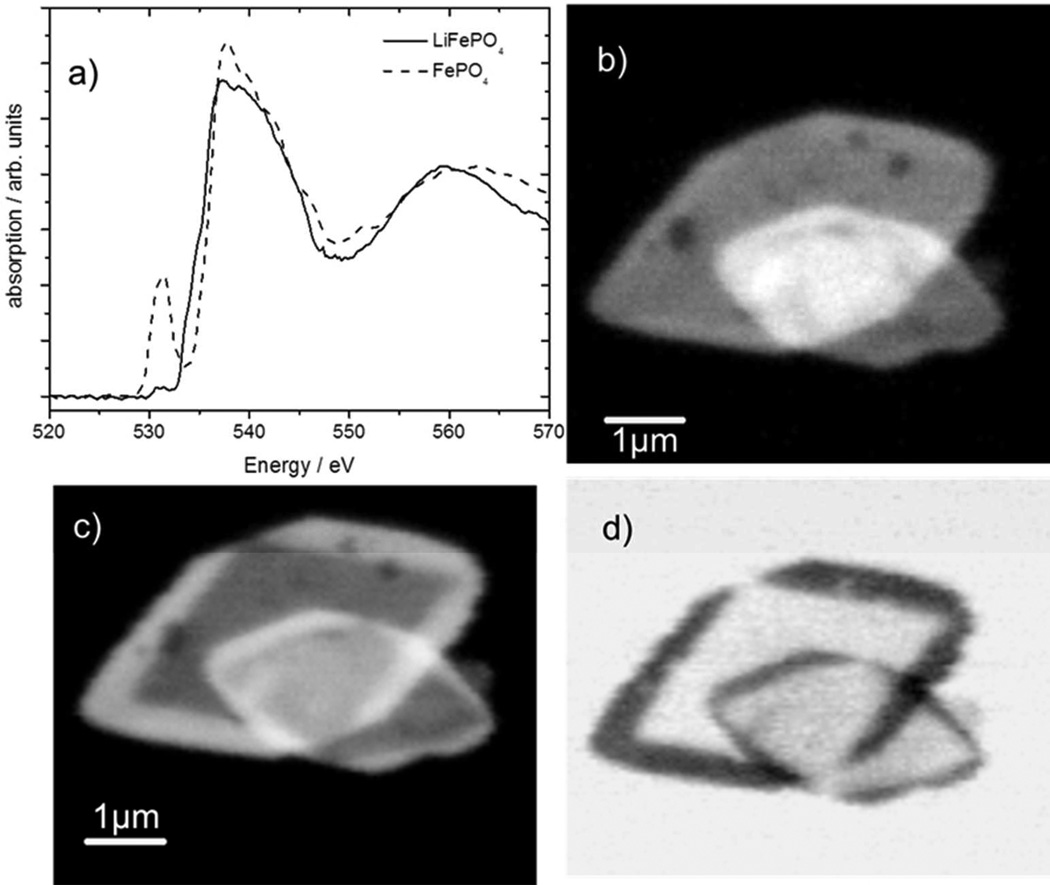
The chemical phase distribution in hydrothermally grown micrometric single crystals LiFePO4 following partial chemical delithiation was investigated. Full field and scanning X-ray microscopy were combined with X-ray absorption spectroscopy at the Fe K- and O K-edges, respectively, to produce maps with high chemical and spatial resolution. The resulting information was compared to morphological insight into the mechanics of the transformation by scanning transmission electron microscopy. This study revealed the interplay at the mesocale between microstructure and phase distribution during the redox process, as morphological defects were found to kinetically determine the progress of the reaction. Lithium deintercalation was also found to induce severe mechanical damage in the crystals, presumably due to the lattice mismatch between LiFePO4 and FePO4. Our results lead to the conclusion that rational design of intercalation-based electrode materials, such as LiFePO4, with optimized utilization and life requires the tailoring of particles that minimize kinetic barriers and mechanical strain. Coupling TXM-XANES with TEM can provide unique insight into the behavior of electrode materials during operation, at scales spanning from nanoparticles to ensembles and complex architectures.

Keywords: LiFePO4; battery electrode materials; chemical imaging; intercalation reactions.


Figures

Figure 1
Figure 1
Representative STEM HAADF images of pristine a) and c) of partially delithiated crystals in a sample with nominal composition Li0.5FePO4. The dashed line in a) is provided as a guide to the eye to differentiate regions of high and low defect density. Representative SEM images of b) pristine and d) delithiated LixFePO4 crystals. The same batch of crystals was studied in both cases.
Figure 2
Figure 2
Normalized absorption spectra of single-phase FePO4 (open symbols) and LiFePO4 (filled), collected by FF TXM, obtained by integrating the intensity of a full FOV containing multiple single-phase particles.
Figure 3
Figure 3
a) FF TXM image of a selected crystal in a sample with nominal composition Li0.74FePO4 collected at 7080eV; b) chemical phase map obtained by LC fitting of XANES data at each pixel.
Figure 4
Figure 4
Results of the k-means clustering in PC space performed for a selected crystal in a sample with nominal composition Li0.74FePO4. a) Score plot, i.e. pixels of the data set projected into 2 dimensional PC space (PC1 and PC2). Colors indicate the cluster to which each pixel has been assigned by the k-means algorithm. b) Cluster index image displaying the distribution of pixels assigned to each of the 5 clusters determined by k-means clustering. c) Average XANES of all pixels in each cluster, as indicated.
Figure 5
Figure 5
Selected single pixel XANES, and results of LC fitting with FePO4 and LiFePO4 standards. Single pixels showing poor signal-to-noise ratios due to a low Fe concentration were filtered out by setting their intensity to 0 intensity at all energies.
Figure 6
Figure 6
a) FF TXM image of a selected crystal in a sample with nominal composition Li0.5FePO4 collected at 7220eV; b) chemical phase map obtained by LC fitting of XANES data at each pixel. Regions I and II are magnified by a factor of 2 from panel b. The white arrows point at an elongated domain with higher delithiation in the center of the crystal.
Figure 7
Figure 7
a) O-K edge XAS of LiFePO4 (solid) and FePO4 (dashed) obtained from a line scan in STXM mode. STXM images of selected crystals in a sample with nominal composition Li0.5FePO4 collected at b) 528eV and c) 532.8eV; d) map of FePO4 (dark areas) obtained by normalization of c) using b).

References

    1. Goodenough JB, Kim Y. Chem. Mater. 2009;22:587.
    1. Whittingham MS. Chem. Rev. 2004;104:4271. - PubMed
    1. Park C-M, Kim J-H, Kim H, Sohn H-J. Chem. Soc. Rev. 2010;39:3115. - PubMed
    1. Wagemaker M, Mulder FM, Van der Ven A. Adv. Mater. 2009;21:2703. - PubMed
    1. Belak AA, Wang Y, Van der Ven A. Chem. Mater. 2012;24:2894.

LinkOut - more resources