

Mechanisms of trichostatin A inhibiting AGS proliferation and identification of lysine-acetylated proteins
- PMID: 23745024
- PMCID: PMC3671074
- DOI: 10.3748/wjg.v19.i21.3226
Mechanisms of trichostatin A inhibiting AGS proliferation and identification of lysine-acetylated proteins
Abstract
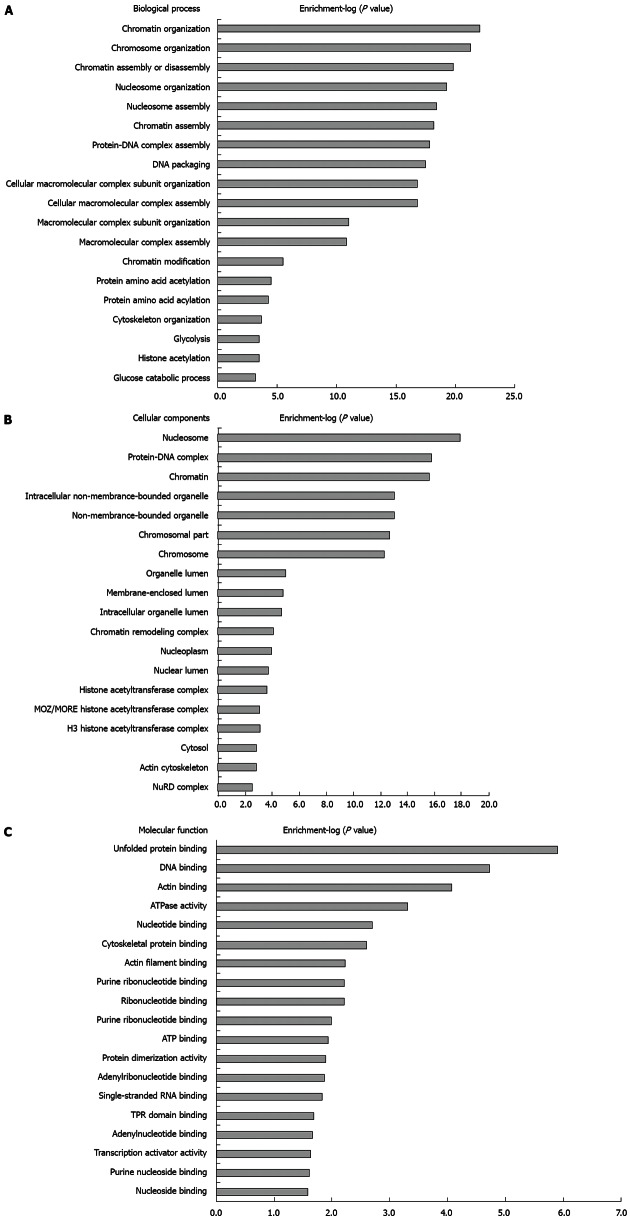
Aim: To explore the effect of lysine acetylation in related proteins on regulation of the proliferation of gastric cancer cells, and determine the lysine-acetylated proteins and the acetylated modified sites in AGS gastric cancer cells.
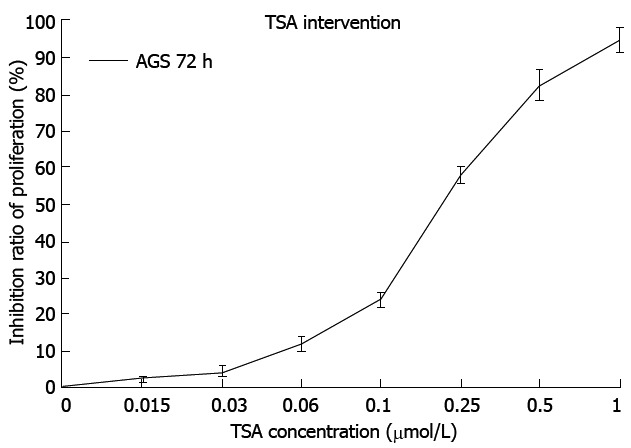
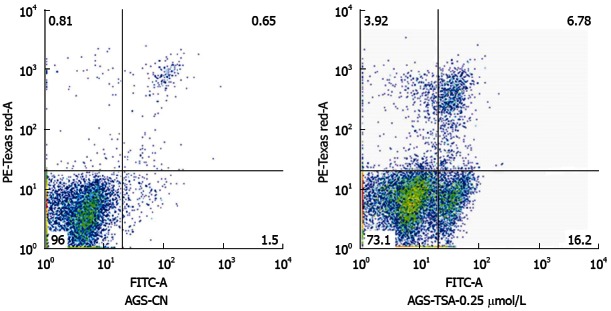
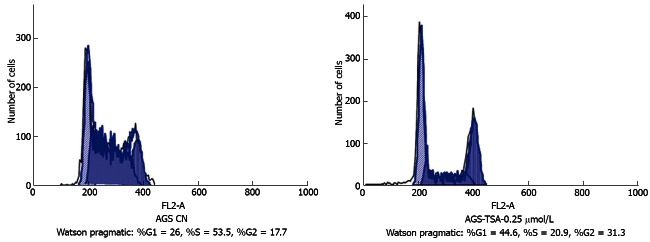
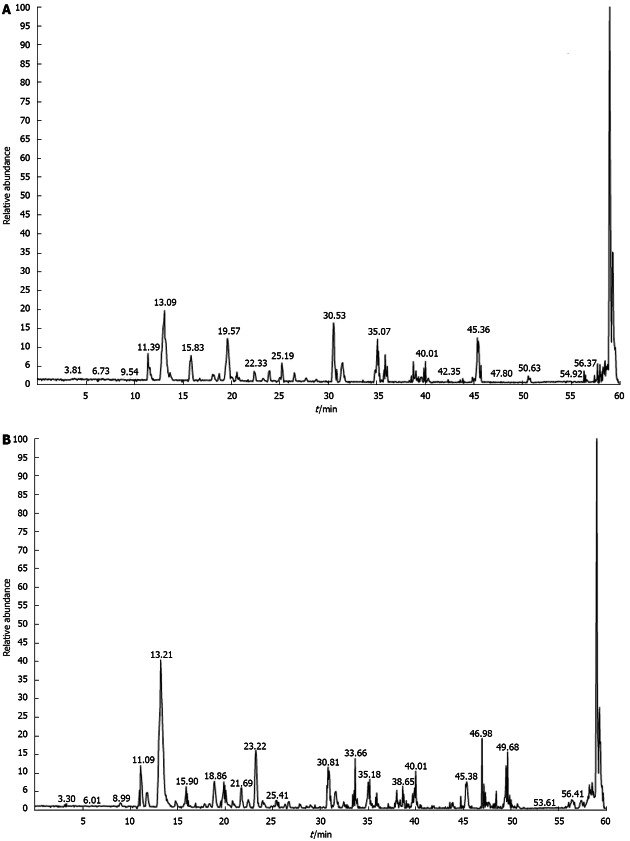
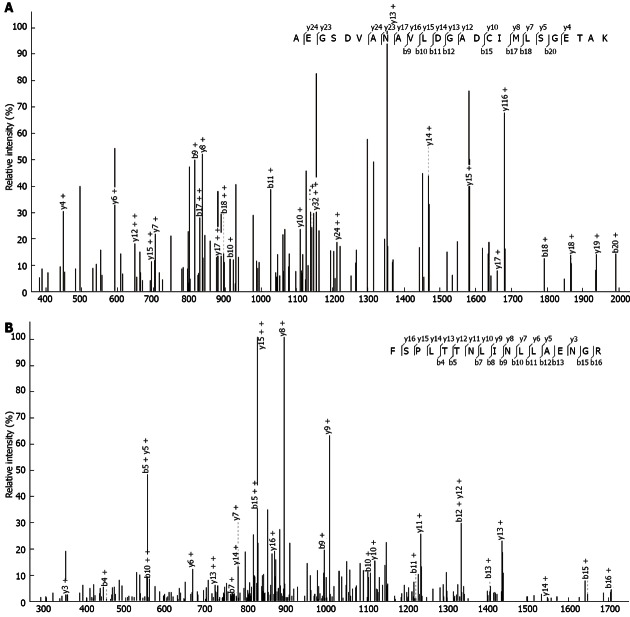
Methods: The CCK-8 experiment and flow cytometry were used to observe the changes in proliferation and cycle of AGS cells treated with trichostatin A (TSA). Real time polymerase chain reaction and Western blotting were used to observe expression changes in p21, p53, Bax, Bcl-2, CDK2, and CyclinD1 in gastric cancer cells exposed to TSA. Cytoplasmic proteins in gastric cancer cells before and after TSA treatment were immunoprecipitated with anti-acetylated lysine antibodies, separated using sodium dodecyl sulfate polyacrylamide gel electrophoresis gel and silver-stained to detect the proteins by mass spectrometry after removal of the gel. The acetylated proteins in AGS cells were enriched with lysine-acetylated antibodies, and a high-resolution mass spectrometer was used to detect the acetylated proteins and modified sites.
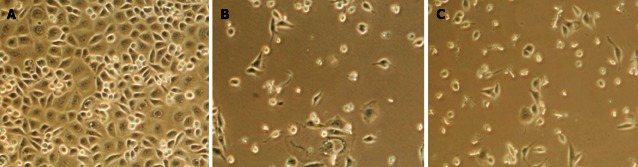
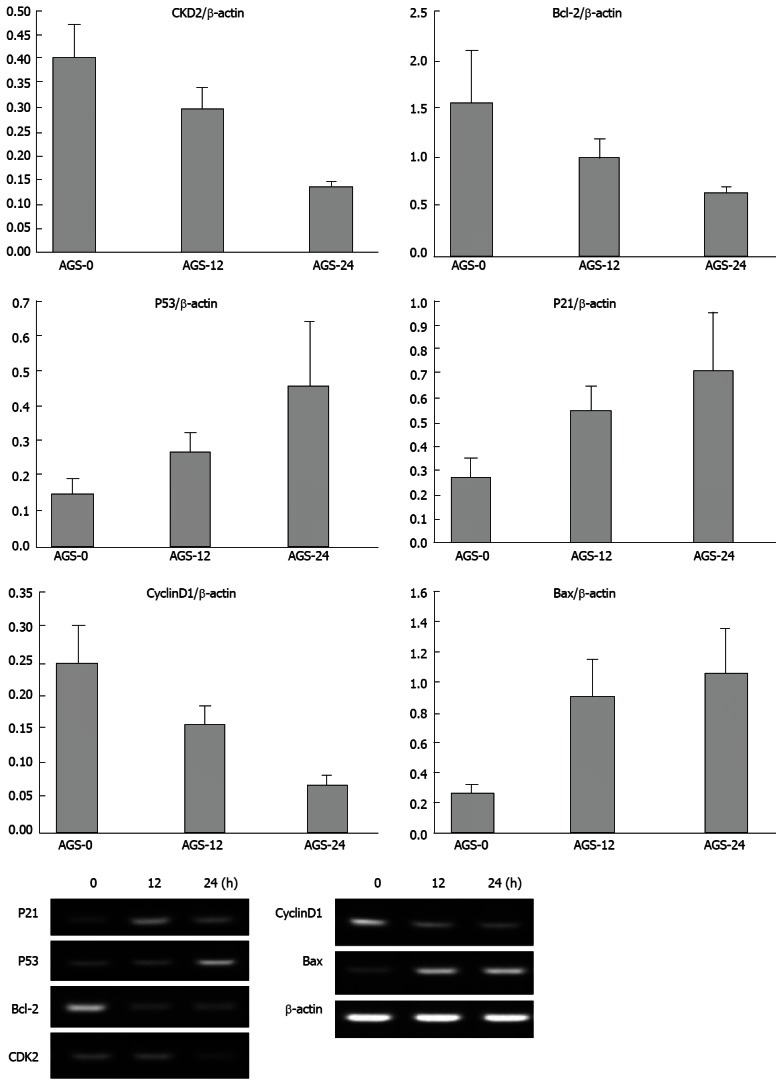
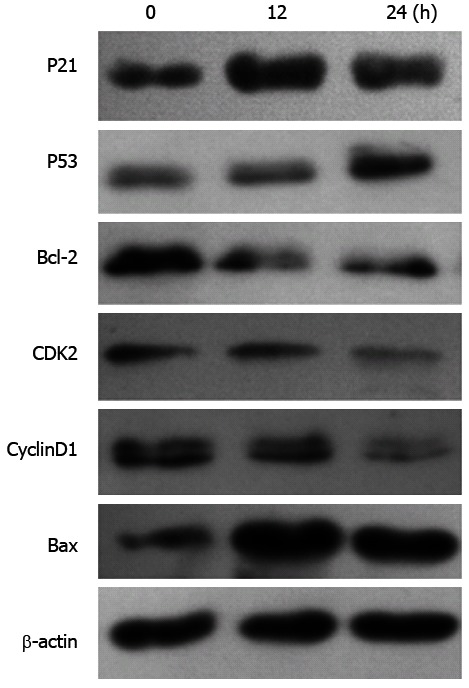
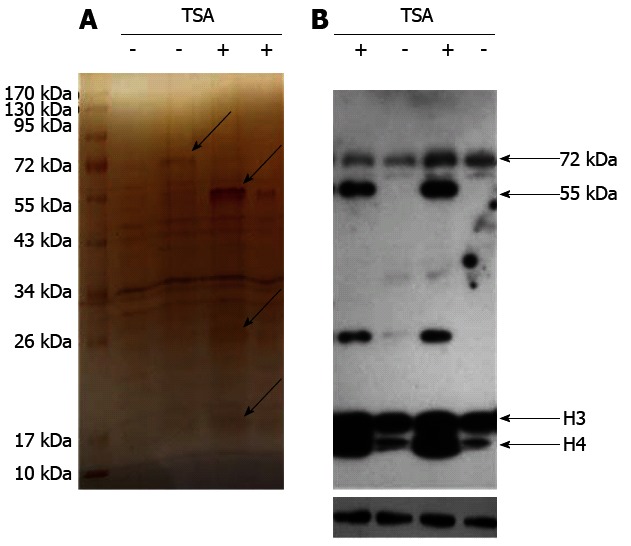
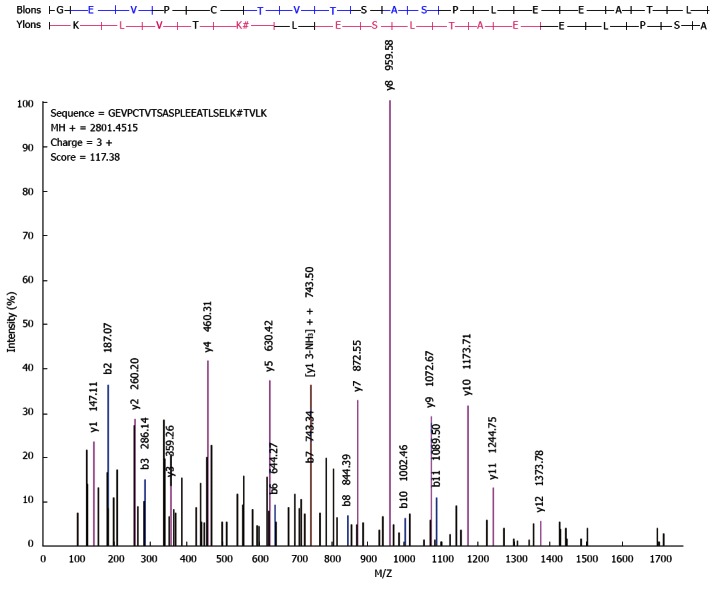
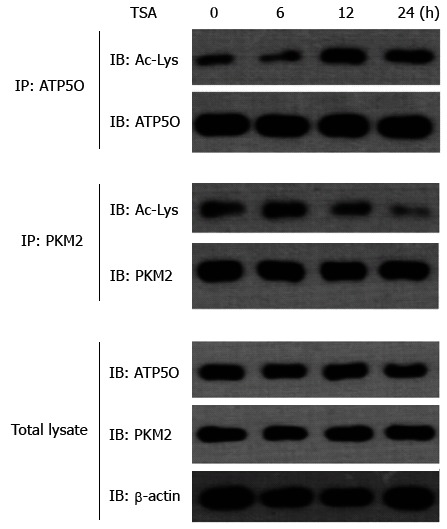
Results: TSA significantly inhibited AGS cell proliferation, and promoted cell apoptosis, leading to AGS cell cycle arrest in G0/G1 and G2/M phases, especially G0/G1 phase. p21, p53 and Bax gene expression levels in AGS cells were increased with TSA treatment duration; Bcl-2, CDK2, and CyclinD1 gene expression levels were decreased with TSA treatment duration. Two unknown protein bands, 72 kDa (before exposure to TSA) and 28 kDa (after exposure to TSA), were identified by silver-staining after immunoprecipitation of AGS cells with the lysine-acetylated monoclonal antibodies. Mass spectrometry showed that the 72 kDa protein band may be PKM2 and the 28 kDa protein band may be ATP5O. The acetylated proteins and modified sites in AGS cells were determined.
Conclusion: TSA can inhibit gastric cancer cell proliferation, which possibly activated signaling pathways in a variety of tumor-associated factors. ATP5O was obviously acetylated in AGS cells following TSA treatment.
Keywords: ATP5O; Acetylation modification; Gastric cancer; Mass spectrometry; PKM2; Trichostatin A.
Figures
Similar articles
-
Histone Deacetylase Inhibitor Trichostatin A Suppresses Cell Proliferation and Induces Apoptosis by Regulating the PI3K/AKT Signalling Pathway in Gastric Cancer Cells.Anticancer Agents Med Chem. 2020;20(17):2114-2124. doi: 10.2174/1871520620666200627204857. Anticancer Agents Med Chem. 2020. PMID: 32593284
-
Effect of trichostatin A on anti HepG2 liver carcinoma cells: inhibition of HDAC activity and activation of Wnt/β-Catenin signaling.Asian Pac J Cancer Prev. 2014;15(18):7849-55. doi: 10.7314/apjcp.2014.15.18.7849. Asian Pac J Cancer Prev. 2014. PMID: 25292076
-
P53-dependent antiproliferative and pro-apoptotic effects of trichostatin A (TSA) in glioblastoma cells.J Neurooncol. 2012 May;107(3):503-16. doi: 10.1007/s11060-011-0791-2. Epub 2012 Jan 20. J Neurooncol. 2012. PMID: 22270849
-
Gastric cancer cell lines induced by trichostatin A.World J Gastroenterol. 2008 Aug 14;14(30):4810-5. doi: 10.3748/wjg.14.4810. World J Gastroenterol. 2008. PMID: 18720545 Free PMC article.
-
Protein Acetylation at the Interface of Genetics, Epigenetics and Environment in Cancer.Metabolites. 2021 Apr 1;11(4):216. doi: 10.3390/metabo11040216. Metabolites. 2021. PMID: 33916219 Free PMC article. Review.
Cited by
-
The tumor promoting roles of erythropoietin/erythropoietin receptor signaling pathway in gastric cancer.Tumour Biol. 2016 Aug;37(8):11523-33. doi: 10.1007/s13277-016-5053-7. Epub 2016 Apr 16. Tumour Biol. 2016. PMID: 27086036
-
Givinostat inhibition of hepatic stellate cell proliferation and protein acetylation.World J Gastroenterol. 2015 Jul 21;21(27):8326-39. doi: 10.3748/wjg.v21.i27.8326. World J Gastroenterol. 2015. PMID: 26217084 Free PMC article.
-
Identification of a nine-gene prognostic signature for gastric carcinoma using integrated bioinformatics analyses.World J Gastrointest Oncol. 2020 Sep 15;12(9):975-991. doi: 10.4251/wjgo.v12.i9.975. World J Gastrointest Oncol. 2020. PMID: 33005292 Free PMC article.
-
Claudin-10 overexpression suppresses human clear cell renal cell carcinoma growth and metastasis by regulating ATP5O and causing mitochondrial dysfunction.Int J Biol Sci. 2022 Mar 6;18(6):2329-2344. doi: 10.7150/ijbs.70105. eCollection 2022. Int J Biol Sci. 2022. PMID: 35414767 Free PMC article.
-
Epigenetic alterations of gastrokine 1 gene expression in gastric cancer.Oncotarget. 2017 Mar 7;8(10):16899-16911. doi: 10.18632/oncotarget.14817. Oncotarget. 2017. PMID: 28129645 Free PMC article.
References
Publication types
MeSH terms
Substances
LinkOut - more resources
Full Text Sources
Other Literature Sources
Medical
Research Materials
Miscellaneous
